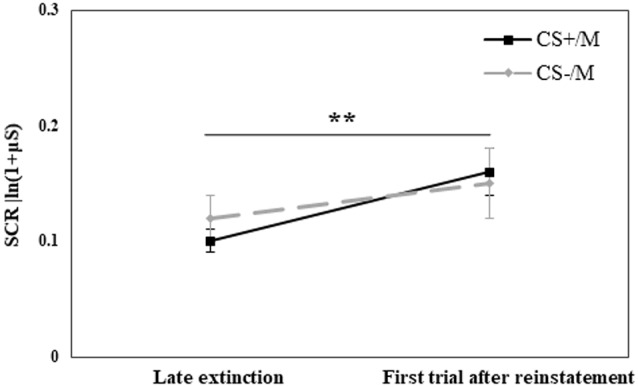
Figure 5.

Day 3: Analyses of the reinstatement test to the modified stimuli compared the mean (± SEM) SCR to the stimuli in the late phase of extinction (mean of last 5 trials of the original CS+ or CS−; late extinction original CS+: RE+CORT: 0.08 ± 0.02; RE: 0.13 ± 0.03; CORT: 0.09 ± 0.02; late extinction original CS−: RE+CORT: 0.09 ± 0.03; RE: 0.14 ± 0.03; CORT: 0.12 ± 0.03) and the first trial after reinstatement (modified stimulus, CS+M or CS−M; first reinstatement trial CS+M: RE+CORT: 0.11 ± 0.03; RE: 0.18 ± 0.04; CORT: 0.18 ± 0.04; first reinstatement trial CS−M: RE+CORT: 0.16 ± 0.05; RE: 0.12 ± 0.04; CORT: 0.18 ± 0.05). The analysis revealed a generalized reinstatement (i.e., to both CS+M and CS−M; **p = 0.005). Since no group effect or interaction were found, the figure presents all three experimental groups combined (N = 73; RE+CORT group: n = 24, RE group: n = 25, CORT group: n = 24).
