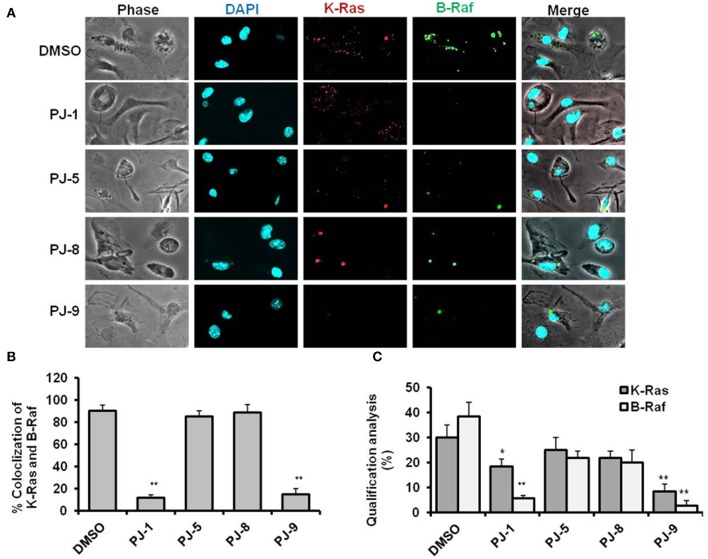
Figure 2.
Representative confocal images of K-Ras and B-Raf proteins in PJ-treated cells. (A) Representative images of immunofluorescent assay indicating the levels of K-Ras (red) and B-Raf (green) in PJ-treated A549 cells compared to DMSO-treated (control). 4′,6-Diamidino-2-Phenylindole, Dihydrochloride (DAPI) was used for chromosome counterstaining (blue). (B) Quantification of K-Ras colocalized with B-Raf mutant proteins. (C) Qualification of K-Ras and B-Raf proteins intensities using ImageJ software. The error bars indicate the stranded deviation (SD) of three independent experiments. Student two-tailed t-test was used for significance analysis of proteins quantification values. *P < 0.05 was considered statistically significant and **P < 0.01 as highly significant.

