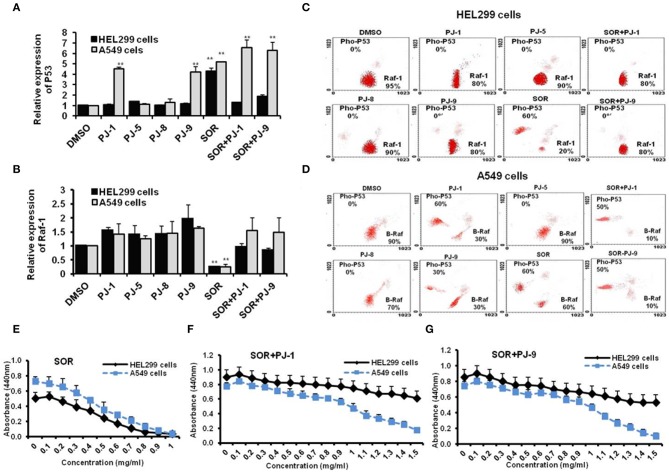
Figure 3.
Expression profile of Raf-1, mutant B-Raf, and phosphorylated P53 in SOR and/or PJ-treated cells. (A) Steady-state mRNA of P53 gene indicated by fold change in SOR and/or PJ-treated cells compared with DMSO-treated cells. (B) Steady-state mRNA of Raf-1 gene indicated by fold change in SOR and/or PJ-treated cells in comparison with DMSO-treated cells. Levels of GAPDH-mRNA were used as an internal control. Error bars indicate the SD of three independent experiments. Student two-tailed t-test was used for significance analysis of cycle threshold (Ct) values. (C) Steady flow cytometry fractionation quantifies kinetic profile of Raf-1 and pho-P53 proteins in treated HEL299 cells in comparison with DMSO treated cells. (D) Quantified protein profile of both B-Raf and pho-P53 in treated A549 indicated by flow cytometry and compared to DMSO-treated cells. (E–G) Cell viability rate of normal and cancer cells that were pre-treated with SOR, SOR+PJ-1, and SOR+PJ-9, respectively. Error bars indicate the SD of four different replicates. **P < 0.01 was considered as highly significant.

