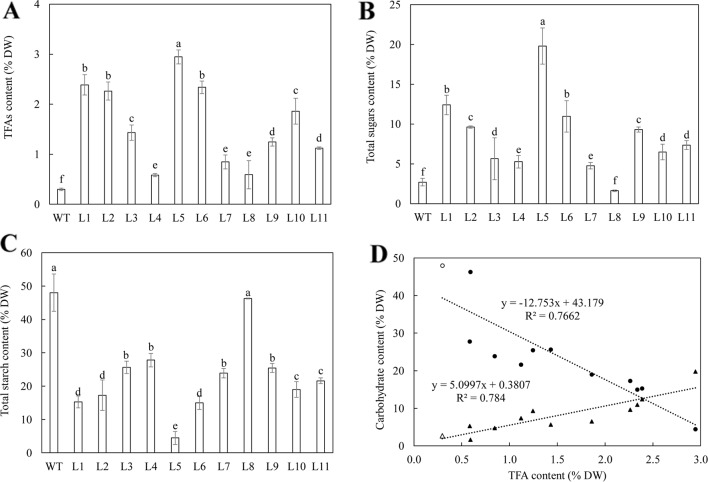
Figure 1.
Contents of total fatty acids (TFA) and major carbohydrate in the mature potato tubers of WT and the eleven selected T0 generation plants. (A) TFA content; (B) Total soluble sugars content; (C) Total starch content; (D) Regression analysis among TFA, total soluble sugars (triangles) and starch (circles) in WT (open symbols) and transgenic lines (black symbols). The relationship between TFA and starch is negative (y = -12.753x + 43.179, R² = 0.7662), while the relationship between TFA and the total soluble sugars is positive (y = 5.0997x + 0.3807, R² = 0.784). The data represent the mean values ± standard deviation (SD) of three biological replicates. Letters (a, b, c, etc.) above the bars are all based on the least significant difference (LSD). Different letters between lines are statistically significantly different at P < 0.05.

