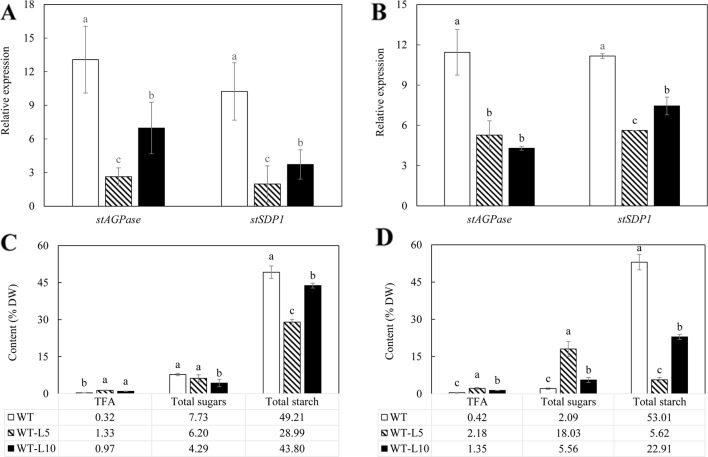
Figure 2.
Gene expression analysis and total carbon allocation in the potato tubers of WT (open bars) and the two selected WT-derived lines, WT-L5 (hatched bars) and WT-L10 (black bars) at two developmental stages. (A) Real-time quantitative reverse transcription polymerase chain reaction (qRT-PCR) result at the flowering stage; (B) Real-time qRT-PCR result at the mature stage; (C) Total carbon allocation at the flowering stage; (D) Total carbon allocation at the mature stage. The data represent the mean values ± SD of three biological replicates. Letters (a, b, c) above the bars are based on LSD, bars marked with different letters are statistically significantly different at P < 0.05.

