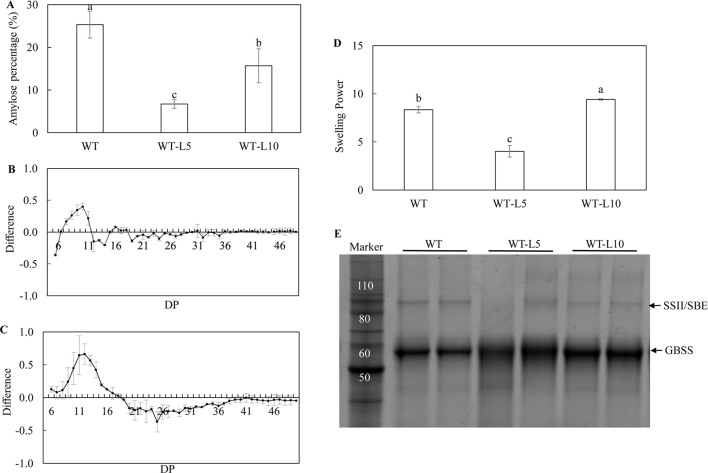
Figure 4.
Analysis of the starch properties in the mature potato tubers. (A) Amylose content; (B) Chain length distribution (CLD) variation in debranched starch samples of WT-L5 relative to WT; (C) CLD variation in debranched starch samples of WT-L10 relative to WT; The CLD was reflected as the degree of polymerization (DP), each mark above the horizontal axis corresponds to the difference of a chain length in mole percentage. The error bars represent the standard errors, and the difference value was obtained by subtracting the CLD of WT from the two selected RNAi lines, respectively. (D) Swelling power of potato flour; (E) SDS-PAGE of potato starch granule bound proteins (GBPs). The data represent the mean values ± SD of three biological replicates. Letters (a, b, c) above the bars are based on least significant difference (LSD), bars marked with different letters are statistically significantly different at P < 0.05.

