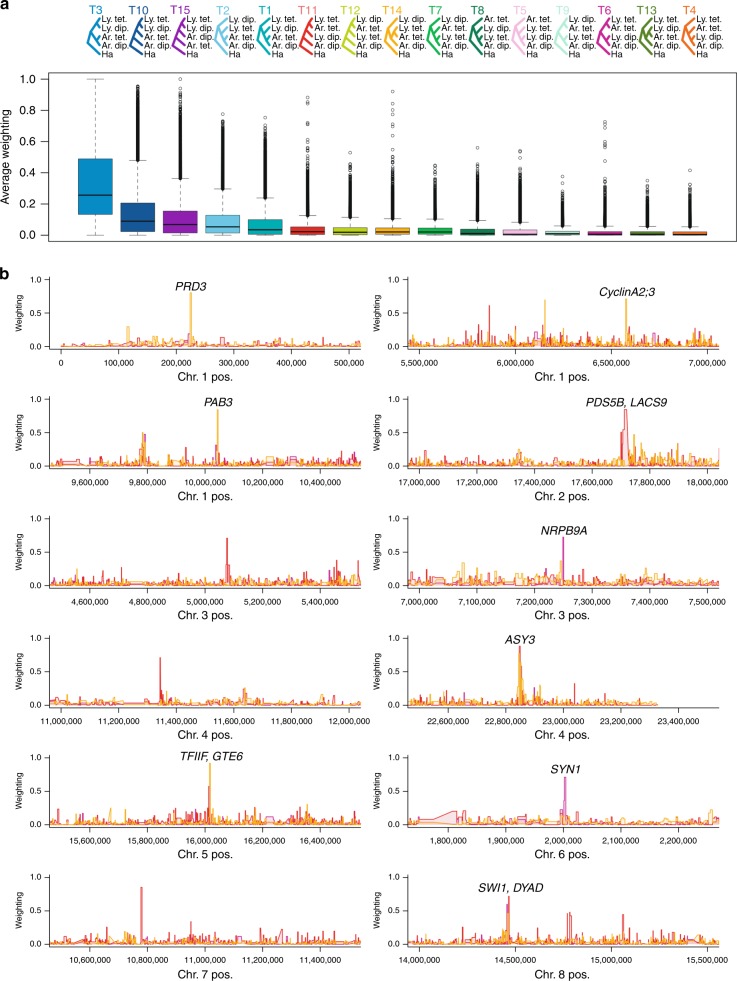
Fig. 3.
Highly specific introgression events across species boundaries. a Topologies from Twisst analysis of Lwt: Although topology 3 is the dominant species tree, topologies 11, 14 and 6 indicate localised gene flow between tetraploids. Box plots give relative weightings of all topologies across the genomes analysed. It is noteworthy that the extreme outliers concentrate specifically on the introgression-indicative topologies 11, 14 and 6. The bold line indicates the median. The box spans the first and third quartiles, and the whiskers extend to the most extreme point within 1.5 times the interquartile range from the box. Source data are provided as a Source Data file. b Introgression events revealed by Twisst analysis are highly localised at loci encoding genes controlling meiosis, endopolyploidy, and transcriptional control. All gene-coding loci under a given narrow peak are labelled; many of the indicated loci are divergence scan outliers in both the Let and Lwt divergence scans in addition to being Twisst outliers. The genome-wide dominant topology 3 weightings are omitted in b for clarity. The colours in b correspond to topologies 11, 14 and 6 in a. The weighting quantifies the extent to which each 50 SNP window tree matches a given topology, accounting for the fact that each taxon is represented my multiple individuals that each have 2 (for diploids) or 4 (for tetraploids) tips in the tree. A weighting of 1 indicates that all individuals cluster in the same way, such that all possible subtrees match the same topology. Weightings >0 but <1 indicate that different subtrees match different topologies. Source data are provided as a Source Data file

