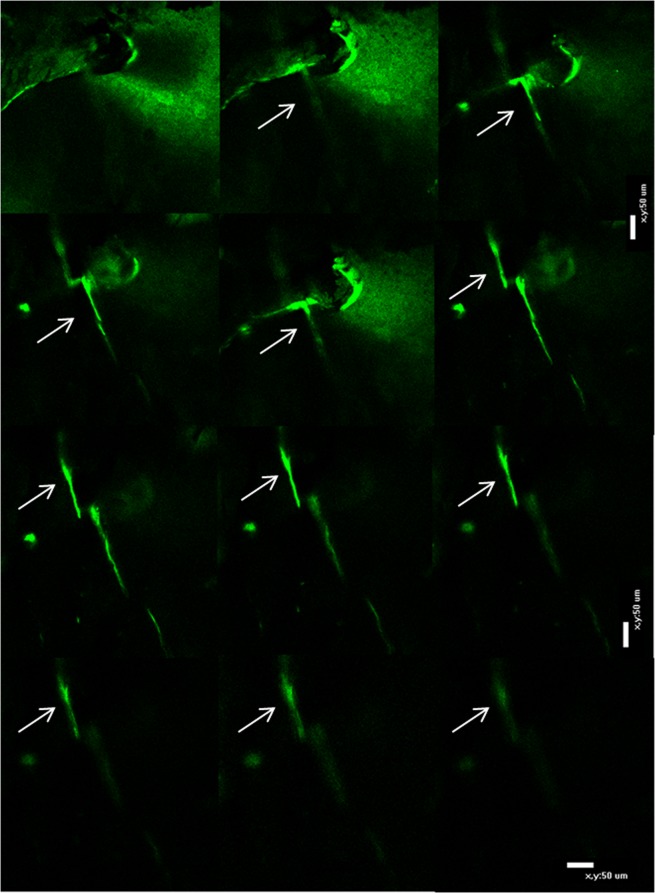
Figure 2.
(a) actively growing surfaces are labeled with calcein (green) and xylenol orange (orange) white arrow. Linear wavy microcrack stained with calcein is also shown (black arrow) (b) linear microcrack stained with calcein shows discrete bridging pattern (c) thin wavy microcrack (white arrow) stained with xylenol orange. (d) tortuous microcrack stained with calcein showing a frontal zone process at its tip (white arrow) (e) linear microcrack and diffuse damage stained with calcein shown by white and red arrows, respectively (f) Microcracks deflect or split (g) as it comes across a microstructural feature (h) calcein stained linear microcrack showing a discrete bridging pattern (i) obliquely placed microcrack showing a discrete bridging behaviour stained with xylenol orange (j) propagating microcracks stained with calcein (white arrow) and xylenol orange (red arrow). Images are taken by a combination filter cube ET-DAPI/FITC/TRITC 69000 for a, e, h, i, j. FITC for images b, d, f, g and TRITC for image c. Scale bar represents 200 µm for a,b,i,j; 100 µm for e,f,g,h and 50 µm for c and d.

