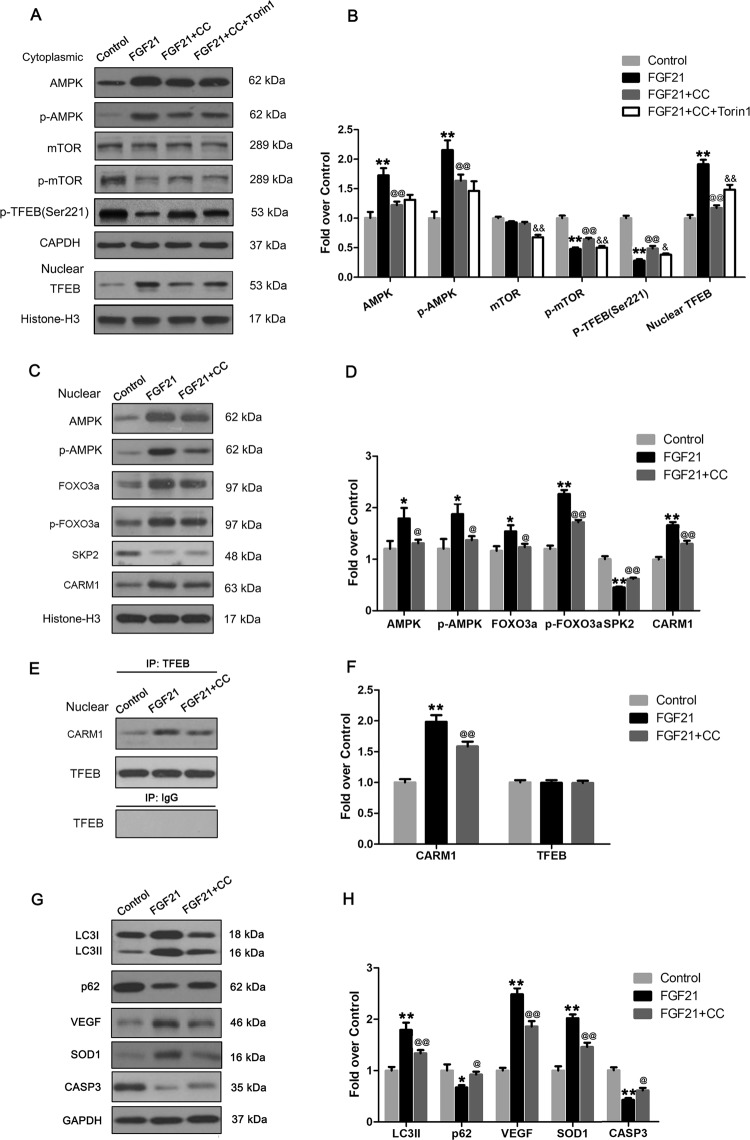
Fig. 8. FGF21 activates AMPK-mTOR pathway and AMPK-FoxO3a-SPK2-CARM1 signaling cascade in flaps.
On the 7th day after operation, samples were harvested from the Control, FGF21, FGF21 + CC, FGF21 + CC + Torin1 groups for the evaluation. a Western blotting showing the cytoplasmic levels of AMPK, p-AMPK, mTOR, p-mTOR and P-TFEB (Ser221) which were corrected by GAPDH as internal control; and nuclear levels of TFEB which were corrected by Histone-H3 as internal control. b Histogram showing quantificational comparison of AMPK, p-AMPK, mTOR and p-mTOR. c Western blotting showing the nuclear levels of AMPK, p-AMPK, FOXO3a, p-FOXO3a, SKP2, and CARM1 which were corrected by Histone-H3 as internal control. d Histogram showing quantificational comparison of AMPK, p-AMPK, FOXO3a, p-FOXO3a, SKP2, and CARM1 between the Control and FGF21 groups. e Western blotting for Immunoprecipitation of CARM1 and TFEB. f Histogram exhibiting the quantification of CARM1 and TFEB levels under Immunoprecipitation. g Western blotting showing levels of proteins of LC3II, p62, VEGF, SOD1, and CASP3 which were corrected by GAPDH as internal control. h Histogram showing quantificational comparison of LC3II, p62, VEGF, SOD1, and CASP3. Significance: *p < 0.05 and **p < 0.01 vs the Control group; @p < 0.05 and @@p < 0.01 vs the FGF21; &p < 0.05 and &&p < 0.01 vs the FGF21 + CC. Data were expressed as means ± SEM (n = 6 per group).

