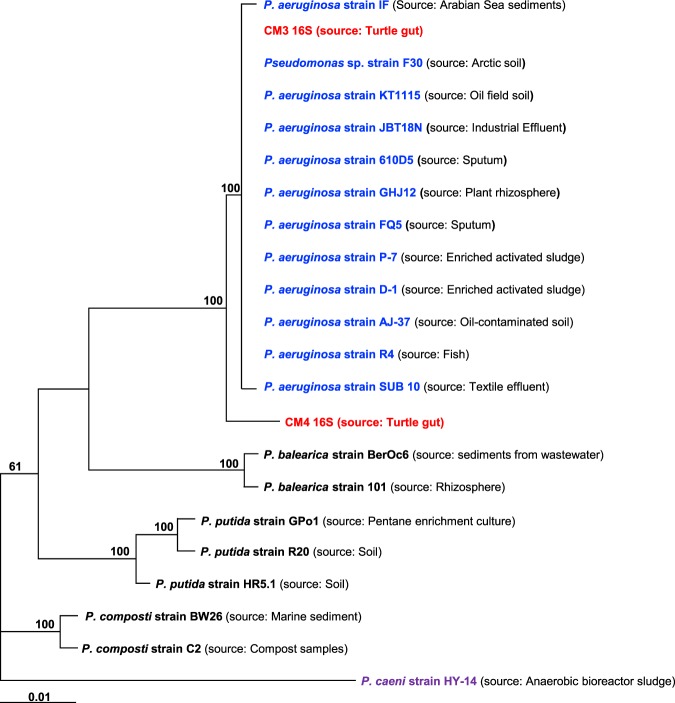
Figure 1.
Phylogenetic tree representing 19 Pseudomonas strains with Pseudomonas caeni as the outgroup and two Pseudomonas strains used in this study (red) based on the phylogenetic analysis of 16 S rRNA genes. The dendogram was reconstructed using the Maximum Likelihood (ML) method (MEGA 7.) based on GTR + G model with concatenated 16 S rRNA sequences. Percentage bootstrap values was higher than 50% of 1000 replicates are indicated at branching nodes.

