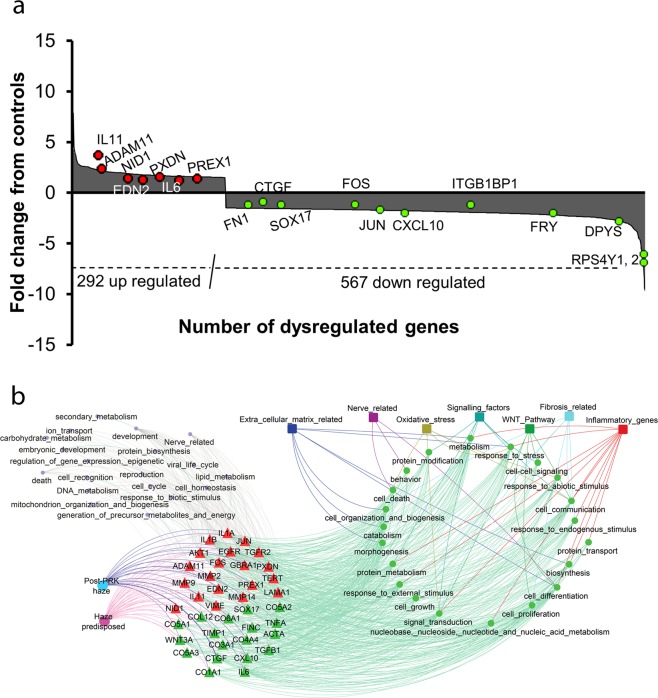
Figure 2.
Microarray of the pooled mRNA samples from haze predisposed and control groups reveals 292 upregulated and 567 downregulated genes cut off > ±2 fold change (p-value < 0.05). (a) Graph represents data of 859 genes differentially regulated. (b) STRING analysis of gene networks and pathways differentially regulated in haze predisposed and post PRK haze groups of patients. 38 differentially expressed genes (triangle shapes, red color signifies up regulation and green down regulation respectively) related to 21 molecular functions (green circles) were observed to be associated with 7 important pathways (square box).

