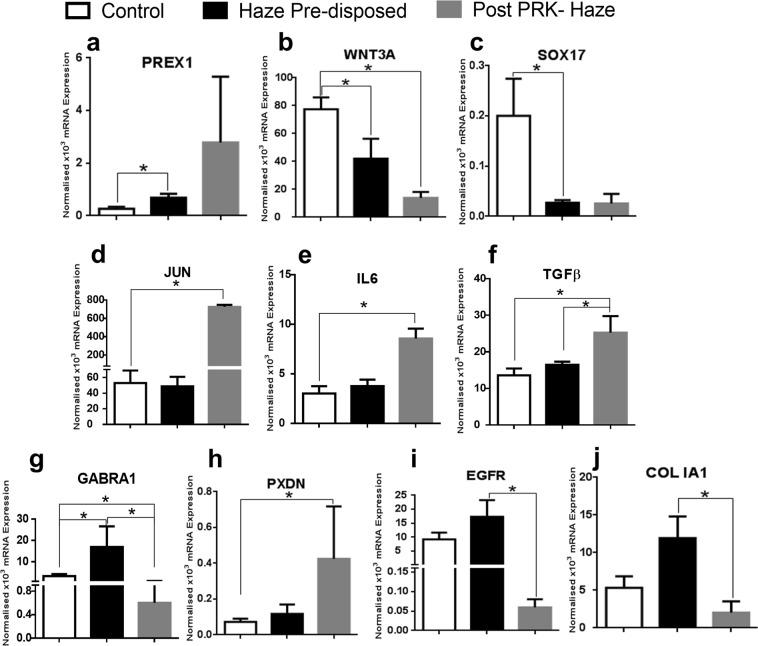
Figure 3.
mRNA expression from corneal epithelium tissues collected intra-operatively. Differentially regulated transcript levels of (a–j) PREX1, WNT3A, SOX17, JUN, IL6, TGFβ, GABRA1, PXDN, EGFR and COLIA1 is represented. Bar graph consists of three groups namely, control (n = 11) represented by white bar, haze predisposed (n = 6) represented by black bar and post PRK haze (n = 3) subjects represented by grey bar. Data shown are mean ± SEM (*p < 0.05).

