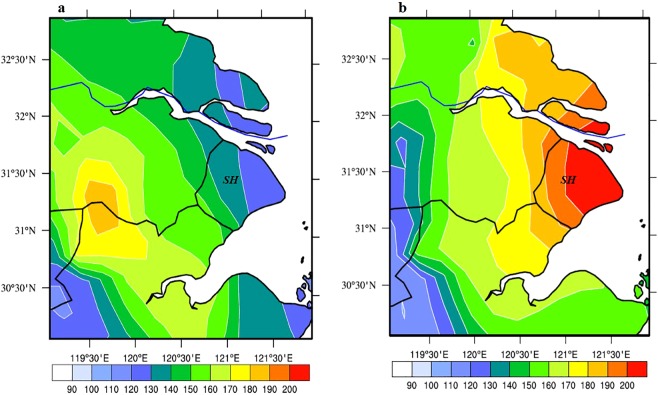
Figure 5.
Monthly mean O3 (MAD1) concentration in Shanghai and its surrounding areas in the weak WPSH case (Aug. 2016) (a), and the strong WPSH case (Jul. 2017) (b). (The ozone data which is measured by the Urban Air Quality Center in China has been interpolated to a rectilinear grid using bilinear interpolation). The O3 concentrations were measured by the Chinese National Environmental Monitoring Center (CNEMC) at 367 monitoring stations and were interpolated to grid data by using iterative improvement objective analysis. The maps were generated using NCL software [The NCAR Command Language (Version 6.3.0) [Software]. (2015). Boulder, Colorado: UCAR/NCAR/CISL/TDD. 10.5065/D6WD3XH5].

