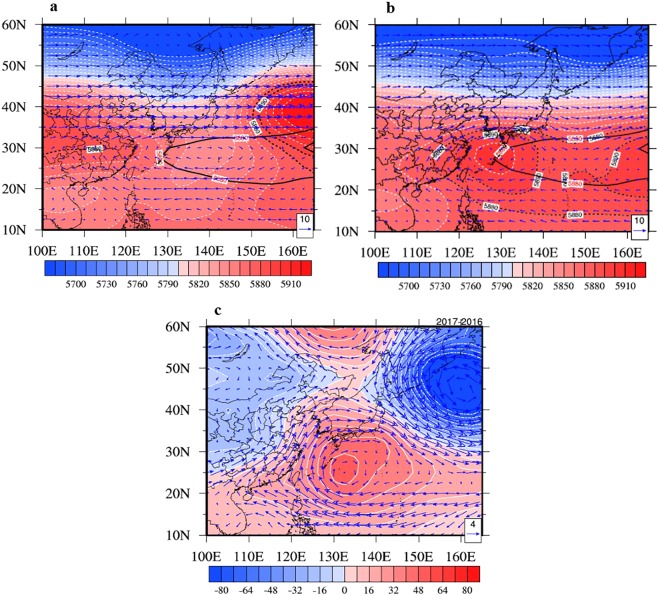
Figure 6.
The actual mid-level (500 hPa) circulations in Aug. 2016 (a) and Jul. 2017 (b) and its anomalies (c) (dash lines represent actual WPSH_SHO3, solid line represents climatological (1988–2017 mean) WPSH_SHO3, the arrows represent the wind vector and the actual geopotential height are shaded). NCEP Reanalysis data provided by the NOAA/OAR/ESRL PSD, Boulder, Colorado, USA, from their Web site at https://www.esrl.noaa.gov/psd/. The maps were generated by NCL software [The NCAR Command Language (Version 6.3.0) [Software]. (2015). Boulder, Colorado: UCAR/NCAR/CISL/TDD. 10.5065/D6WD3XH5].

