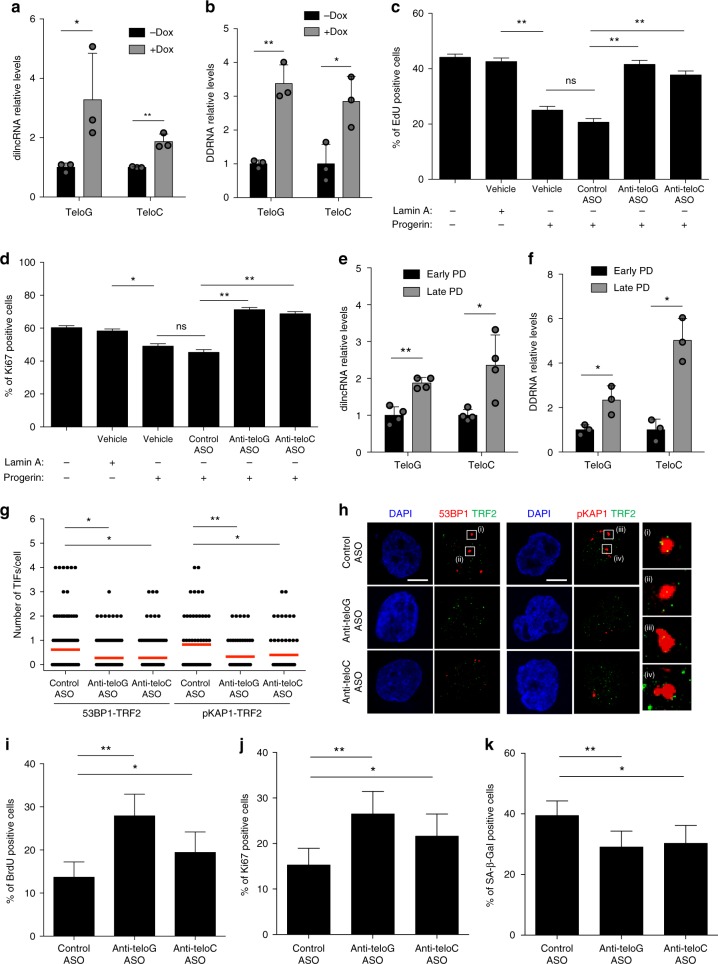
Fig. 2.
Low levels of progerin expression and lamin A G608G mutation cause telomeric dilncRNAs and DDRNAs accumulation and their inhibition reduces proliferative defects and cellular senescence. a, b Total cell RNA was isolated from human fibroblasts carrying a doxycycline (Dox)-inducible progerin lentiviral-based system. a tdilncRNAs were quantified by strand-specific RT-qPCR. Error bars represent s.d., n = 3 independent experiments. *P < 0.05, **P < 0.01; two-tailed Student’s t test. b tDDRNAs were quantified by miScript PCR amplification of gel-extracted small RNAs (shorter than 40 nucleotides). Error bars represent s.d., n = 3 independent experiments. *P < 0.05, **P < 0.01; two-tailed Student’s t test. c, d Lamin A, Progerin-expressing, and control normal dermal fibroblasts (NDF) were transfected with the indicated ASOs. After 9 days cells were pulsed with EdU for 8 h and stained for EdU (c) and Ki67 (d). Bar graphs show the percentage of EdU and Ki67-positive cells ± 95% confidence interval. n = 3 independent experiments. **P < 0.01; Chi-squared test. At least 1000 cells per sample were analyzed. e, f Total cell RNA was isolated from HGPS patient-derived cells at early and late population doubling (PD). e tdilncRNAs were quantified as in a. Error bars represent the s.d. n = 4 independent experiments. *P < 0.05, **P < 0.01; two-tailed Student’s t test. f tDDRNAs were quantified as in b. Error bars represent the s.d. n = 3 independent experiments. *P < 0.05; two-tailed Student’s t test. g Late PD HGPS patient fibroblasts were transfected with the indicated ASOs and stained for 53BP1 or pKap1 (red) and TRF2 (green) to quantify TIFs. Co-localization analysis was assessed as in Fig. 1c. n = 3 independent experiments. *P < 0.05; one-way ANOVA with multiple-comparison post-hoc corrections. At least 100 cells per sample were analyzed. h Representative stack images from quantifications shown in g. Scale bars, 10 μm. i–k HGPS patient fibroblasts from the experiment shown in g were pulsed with BrdU for 24 h prior to fixation and stained for BrdU (i), Ki67 (j), and SA-β-Gal activity (k). Bar graphs show the percentage of BrdU, Ki67, and SA-β-Gal-positive cells ± 95% confidence interval. n = 3 independent experiments. *P < 0.05, **P < 0.01; Chi-squared test. At least 300 cells per sample were analyzed. Source data are provided as a Source Data file

