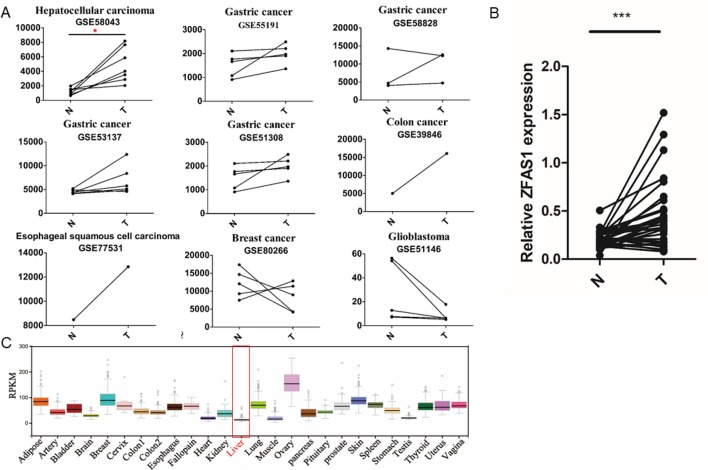
Figure 4.
Expression profiles of ZFAS1 in multiple tumor and normal tissues. (A) ZFAS1 expression levels in 11 cancer-related long non-coding RNA microarray datasets derived from seven cancer types. Y-axis means the signals detected by the microarray. The red asterisk means that the false positive rate (FDR) is less than 0.1. (B) Relative expression levels of ZFAS1 in 32 pairs of hepatocellular carcinoma tumor tissue and corresponding adjacent normal tissue detected by reverse transcription quantitative polymerase chain reaction. ZFAS1 was significantly expressed in tumor tissues (p-value = 1.6e−05, paired Wilcoxon rank sum test, n = 32). (C) Expression profiles of ZFAS1 in 25 normal tissues downloaded from Genotype-Tissue xpression. ZFAS1 was nearly unexpressed in normal liver tissue. N and T represent adjacent normal tissues and tumor tissues. ***P-value < 0.001.

