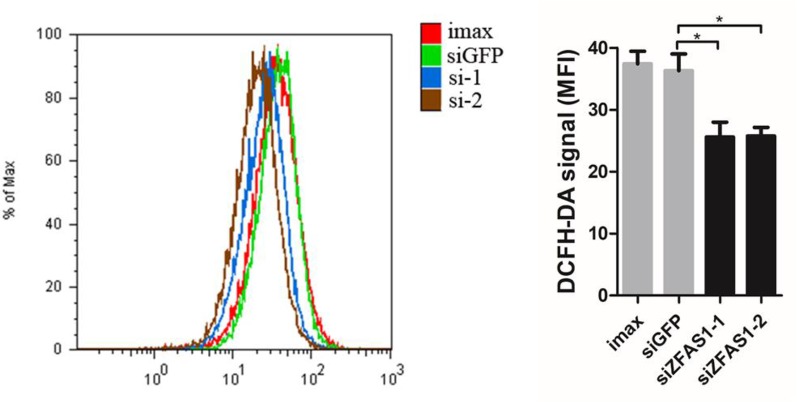
Figure 6.
Change in reactive oxygen species (ROS) production following ZFAS1 knockdown. Cellular ROS production was significantly downregulated following transfection of SK-Hep1 cells with two independent siRNAs (siGFP vs. siZFAS1-1: P-value = 0.022, siGFP vs. siZFAS1-2: P-value = 0.025, paired Student’s t-test, n = 3). Imax means cells exposed to Lipofectamine RNAiMAX but not RNA duplexes. siGFP indicates cells transfected with small interfering RNAs of green fluorescent protein. *P-value < 0.05.

