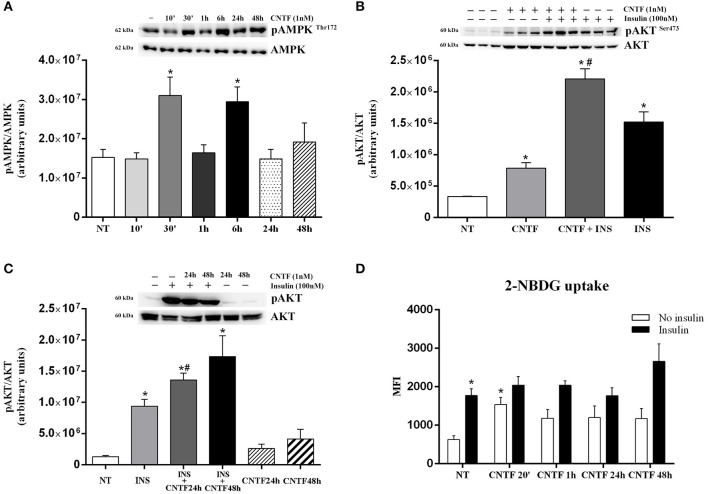
Figure 3.
AMPK and AKT pathway activation in hMADS adipocytes by CNTF. (A) Representative immunoblot and quantification of time-dependent 172-threonine AMPK phosphorylation in hMADS adipocytes treated with 1 nM CNTF. Data (n = 3) are mean ± SEM, *p < 0.05 compared with untreated cells (NT). Data were analyzed using one-way ANOVA. (B) Representative immunoblot and quantification of 473-serine AKT phosphorylation in hMADS adipocytes treated with 1 nM CNTF for 20 min (CNTF); with CNTF and 100 nM insulin for 20 min (INS); and with insulin alone. Data (n = 3) are mean ± SEM, *p < 0.05 compared with untreated cells (NT), #p < 0.05 compared with cells treated with insulin alone. Data were analyzed using one-way ANOVA. (C) Representative immunoblot and quantification of 473-serine AKT phosphorylation detected in hMADS adipocytes treated with 100 nM insulin for 20 min (INS); with 1 nM CNTF for 24 h (CNTF 24 h + INS), or 48 h (CNTF 48 h + INS); only with CNTF for 24 (CNTF 24 h) or 48 h (CNTF 48 h). Data (n = 3) are mean ± SEM, *p < 0.05 compared with untreated cells (NT). Data were analyzed using one-way ANOVA. (D) 2-NBDG uptake, expressed as mean fluorescent intensity (MFI), detected in hMADS adipocytes treated with 1 nM CNTF alone applied for different periods (white bars) or else with 100 nM insulin for 10 min (black bars). Data (n = 3) are from three independent experiments and are mean ± SEM, *p < 0.05 compared with untreated cells (NT). Data were analyzed using Student's t-test.

