Figure 1.
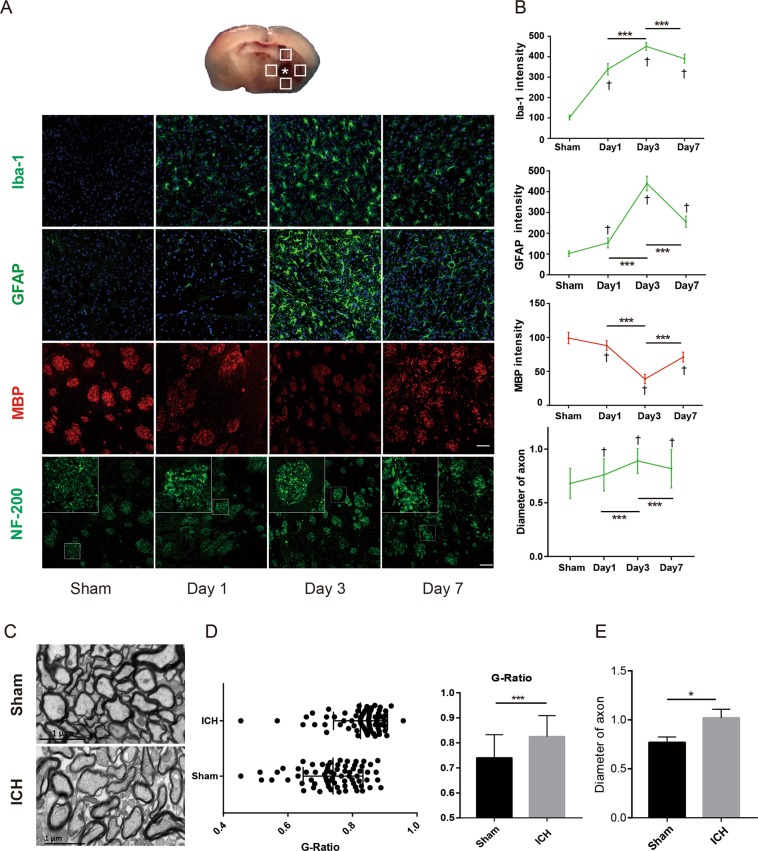
Glia cell activation and myelin damage were assessed from day 1 to day 7 after ICH. (A) The schematic diagrams show the four areas (white squares) for immunofluorescence photography in the perihaematomal region, and the white star indicates the haematoma. Iba1, GFAP-positive cells and MBP in brain sections were identified on days 1, 3 and 7 after ICH. Immunoreactivity of Iba1 (ionized calcium-binding adaptor molecule 1) and GFAP (glial fibrillary acidic protein; astrocyte marker) is shown in green, MBP (myelin basic protein) is shown in red, and NF-200 (neurofilament-200) is shown in green. Nuclei were stained with DAPI (blue). Scale bars: 50 μm (inset column). (B) Intensity of Iba-1, GFAP and MBP staining and diameter of NF-200 were quantified; n = 3 mice and 6 pictures per time point. (C) TEM shows the myelin sheath around the haematoma on day 3 after ICH. (D) G-ratio of different groups (n = 60, 3 mice). (E) Diameter of axons (n = 6 slices, 3 mice). Values are shown as the mean ± S.D., *P < 0.05, **P < 0.01, ***P < 0.001; †P < 0.05 vs. sham.

