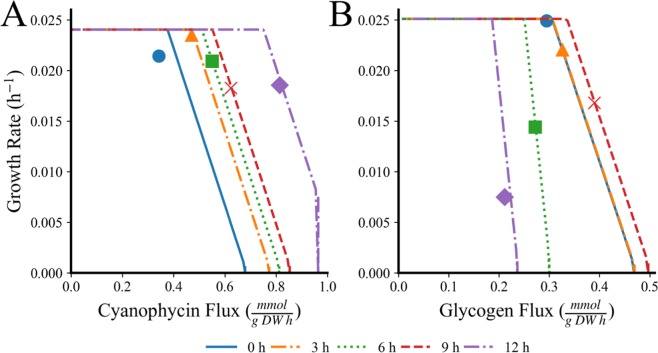
Figure 2.
Pareto Front Progression and Selected Scalar Equation Points over the Light Period in Different Conditions for (A) a diazotrophic cell and (B) a photoautotrophic cell. Each line corresponds to a Pareto Front generated every 3 hours over the course of the light period at the start (blue, solid) through the end (purple, solid-dot) with the point selected by the simulation to best suit cell needs in the scalar objective function indicated as an indication of the permutation of objective weights found in that step and cell’s objective equation (see Methods: Multiobjective Optimization). Simulations were run with atmospheric conditions, 100 μE light, and YBC-II media with 150 cells over 10 filaments with a ratio of 4:11 diazotrophs to photoautotrophs.

