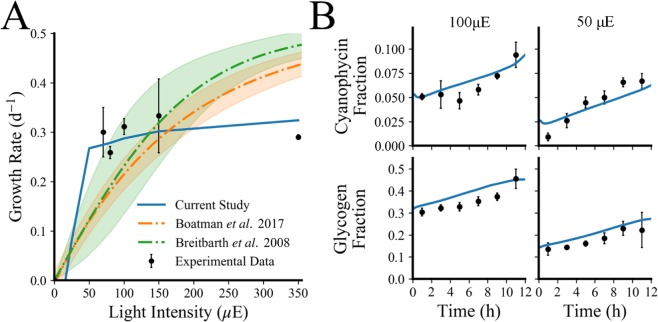
Figure 3.
MiMoSA model validation (A) Growth rate as a function of light intensity in T. erythraeum; here we compare the predictions of growth rate from our model to two published models46,47 and experimental data reported from a variety of literature values1,2,32,42,48,82–84. Error bars represent the error propagated when finding the mean of all separately recorded growth rates in similar conditions (YBC-II media, atmospheric CO2, no added nitrogen, and equivalent light intensity) using standard Euclidean error propagation. (B) Experimentally measured changes (black circles) in biomass accumulation for cells grown in 100 μE and 50 μE compared to simulated values (blue lines). Error bars on the glycogen and cyanophycin measurements represent one standard deviation for three biological replicates.

