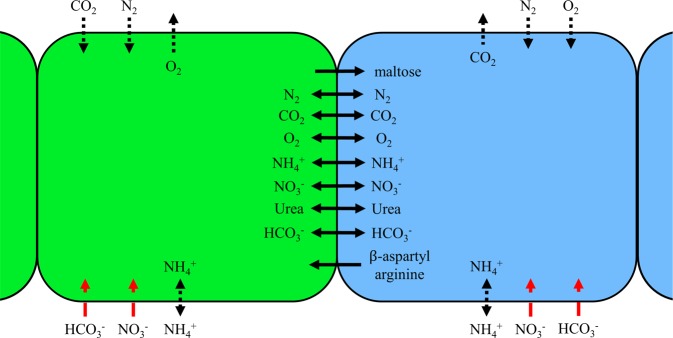
Figure 6.
Allowed Metabolite Diffusion and Exchange between and into Cells. Green cells represent photoautotrophic cells and blue represent diazotrophic cells. Solid black lines indicate free diffusion between cells, dotted black lines indicate lipid bilayer diffusion, and red dashed lines indicate coupled ion transport into the cell. Not pictured is ATP synthase. Maltose is modeled as the 12-carbon molecule that forms the foundation for glycogen while β-aspartyl arginine is the foundation for cyanophycin.

