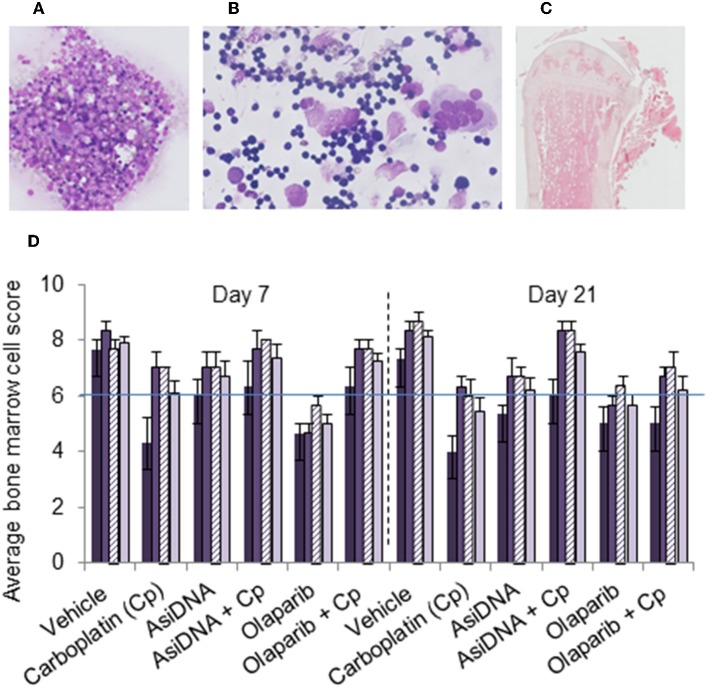
Figure 4.
Bone marrow myelogram. Wright–Giemsa staining of (A) sternal imprints and (B) bone marrow smears and (C) H&E staining of paraffin-embedded tibia. (D) Mean values of bone marrow myelogram (six animals) treated with various treatments (indicated in abscissa) and sacrificed at day 7 or day 21 after the third cycle. Samples were scored from 0 to 10 according to the following scale: poor (0–3), moderate (4–7), or good (8–10) indicating high, moderate, or no toxicity in erythroid (dark violet), myeloid (medium violet), and megakaryocyte score (dashed violet), and density (light violet).

