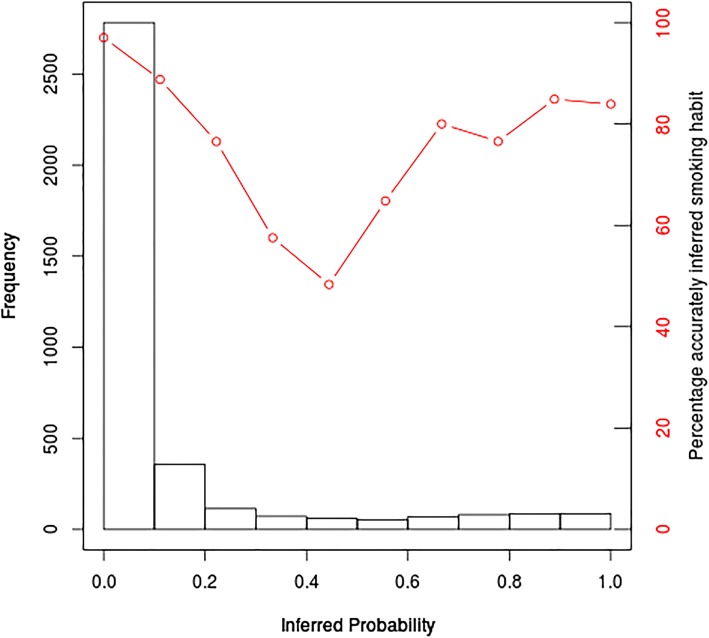
Fig. 3.
Inferred probability of being a smoker versus the percentage of correctly inferred smoking habits. Histogram of predicted probabilities in our model building dataset (N = 3764), probabilities determined using the 13 CpGs included in the final prediction model. The y-axis presents the number of individuals for whom the predicted probability of being a smoker was within the given probability range (x-axis). The red dots present the percentage of individuals in each probability bin that were accurately inferred using a > 0.5 probability threshold for being a smoker

