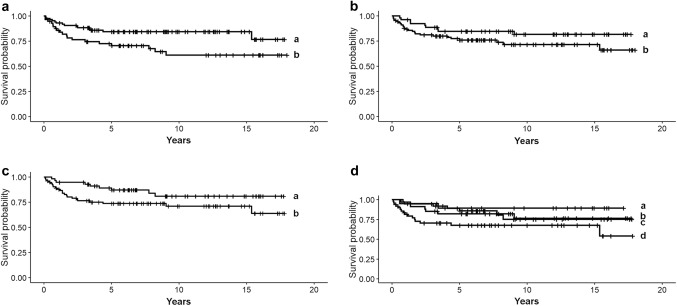
Fig. 1.
Survival of TNBC based on inflammatory response, tumor size and menopausal status of the patients (n = 179). a Patients showing high (≥ 14%, curve a) vs low fraction (< 14%, curve b) of CD8+ T cells (p = 0.02), b pre- (curve a) vs postmenopausal (curve b) patients (p = 0.03), c small (< 2 cm, curve a) vs large (≥ 2 cm, curve b) tumor size (p = 0.02), d small tumor size and premenopausal status (curve a) vs large tumor size and postmenopausal status (curve d) (p = 0.001). The survival of patients with small tumor size and postmenopausal status (curve b) does not significantly differ from patients with large tumor size and premenopausal status (curve c)

