Figure 3.
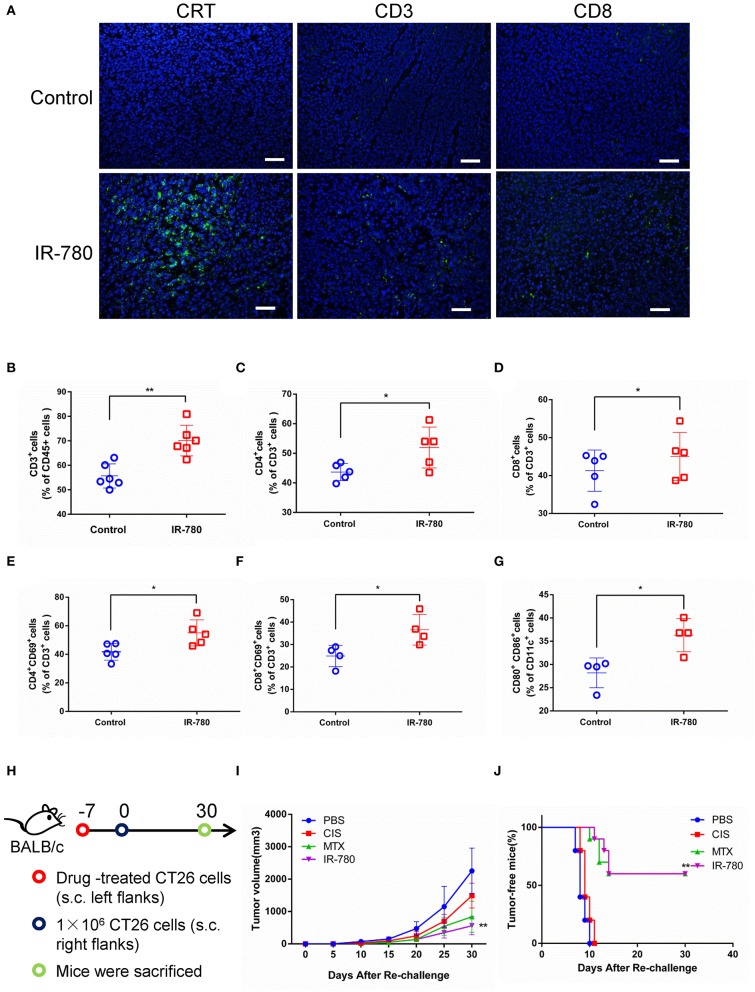
IR-780 induces immunogenic cell death (ICD) in vivo. (A) Immunofluorescence detection of CRT, CD3, and CD8 expression in tumor sections; scale bar = 20 μm. The percentages of tumor-infiltrating (B) CD3+, (C) CD4+, and (D) CD8+ T cells were analyzed by flow cytometry. And the activation of T cell populations was measured by detecting the percentage of (E) CD4+CD69+ and (F) CD8+ CD69+ T cells populations. (G) The activation of CD80+CD86+ DCs was analyzed by flow cytometry. (H) Schedule representation of different treatment-mediated antitumor vaccination effects in CT26 tumor models. (I) After subcutaneous injection of different treated CT26 cells (10 μM IR-780, 1 μM MTX, and 20 μM CIS, respectively) in the left flank of mice, the tumor volumes in the right flank of each group mice were detected and compared (tumor volume = length × width 2 × 0.5). (J) The frequency of tumor-free mice in each group after vaccinated with different pretreated CT26 cells (n = 10). All the data are presented as mean ± SD. *p < 0.05; **p < 0.01 as comparing with control group.

