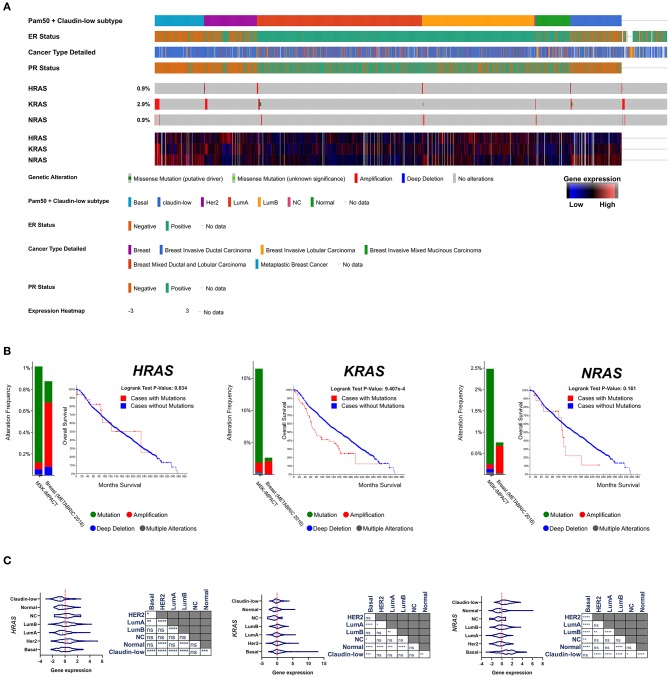
Figure 2.
(A) Frequency of genomic alterations and heatmap of gene expression of the RAS genes (HRAS, KRAS, NRAS) across 2,509 breast tumor samples of the METABRIC cohort (48), assigned to the major intrinsic subtypes (on the basis of the PAM50 profile). (B) The fraction of breast tumors (cases) with genomic alterations (METABRIC cohort, 2,509 breast tumors) of the RAS genes are reported in comparison with the fraction of tumor with genomic alteration in a pan-tumor cohort (MSK-IMPACT, 10945). Kaplan-Mayer curve are reported for each RAS isoform comparing the overall survival of the breast tumors with or without genomic alterations (METABRIC cohort, 2,509 breast tumors). (C) Gene expression level of RAS isoforms across the different subtypes of breast cancer are compared and statistically evaluated by ANOVA t-test (Turkey post-hoc) *p < 0.05; **p < 0.01; ***p < 0.001; ****p < 0.0001. Data have been accessed through cBioportal for Cancer Genomics website (https://www.cbioportal.org).

