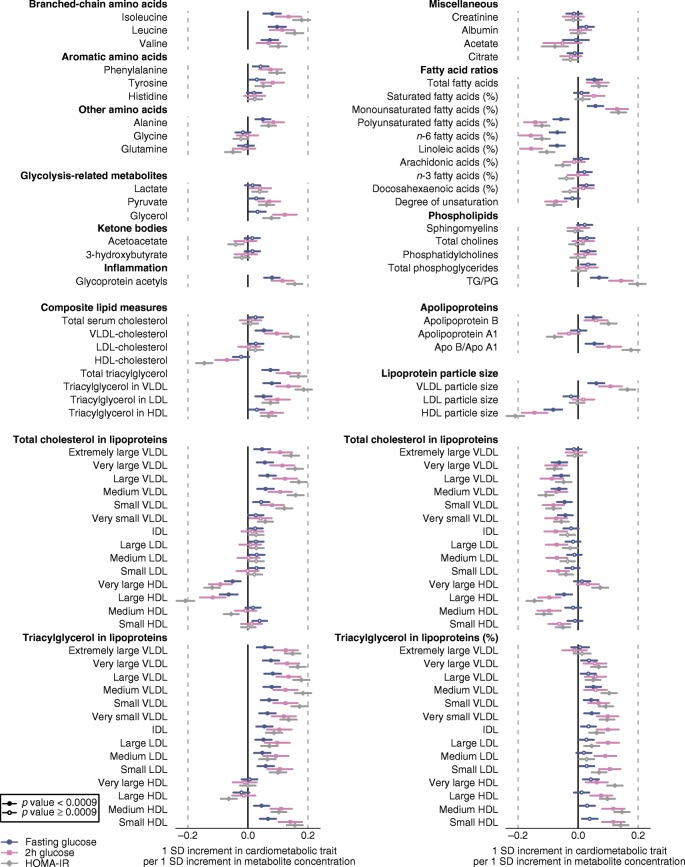
Fig. 3.
Relationship between baseline circulating metabolites and lipids to blood glucose measures at follow-up. The prospective associations were assessed for fasting glucose (n = 5017), 2 h glucose (n = 3028) and HOMA-IR (n = 5010). Values are β-coefficients (95% CIs) scaled to 1 SD in each of the measures of blood glucose per 1 SD loge-transformed metabolite concentration. Associations were adjusted for sex, baseline age, BMI and fasting glucose. ApoA1, apolipoprotein A1; ApoB, apolipoprotein B; PG, phosphoglyceride; TG, triacylglycerol

