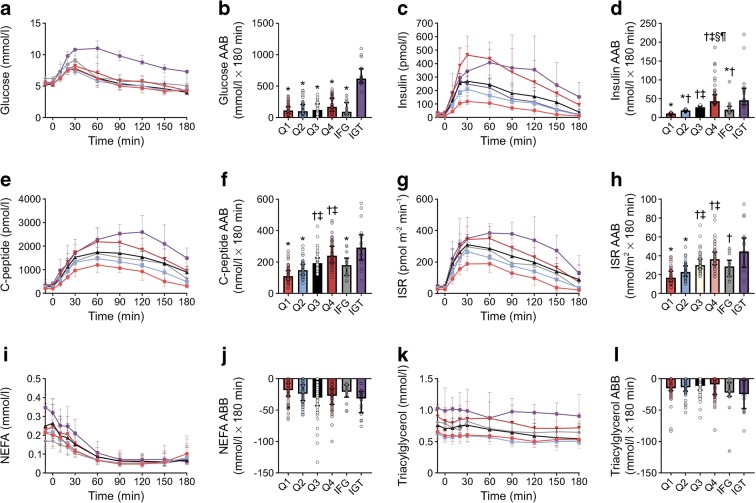
Fig. 1.
Plasma metabolite and hormone concentrations during the OGTT, which began at time 0 min. (a) Plasma glucose concentrations. (b) The AAB for the glucose response. (c) Plasma insulin concentrations. (d) The AAB for the insulin response. (e) Plasma C-peptide concentrations. (f) The AAB for the C-peptide response. (g) ISR. (h) The AAB for the ISR response. (i) Plasma NEFA concentrations. (j) The area below basal (ABB) for the NEFA response. (k) Plasma triacylglycerol concentrations. (l) The ABB for the triacylglycerol response. Pink circles, Q1; blue squares, Q2; black triangles, Q3; red triangles, Q4; grey diamonds, IFG; purple circles, IGT. Data are median and interquartile range. *p< 0.05 vs IGT; †p< 0.05 vs Q1; ‡p< 0.05 vs Q2; §p< 0.05 vs Q3; ¶p< 0.05 vs IFG

