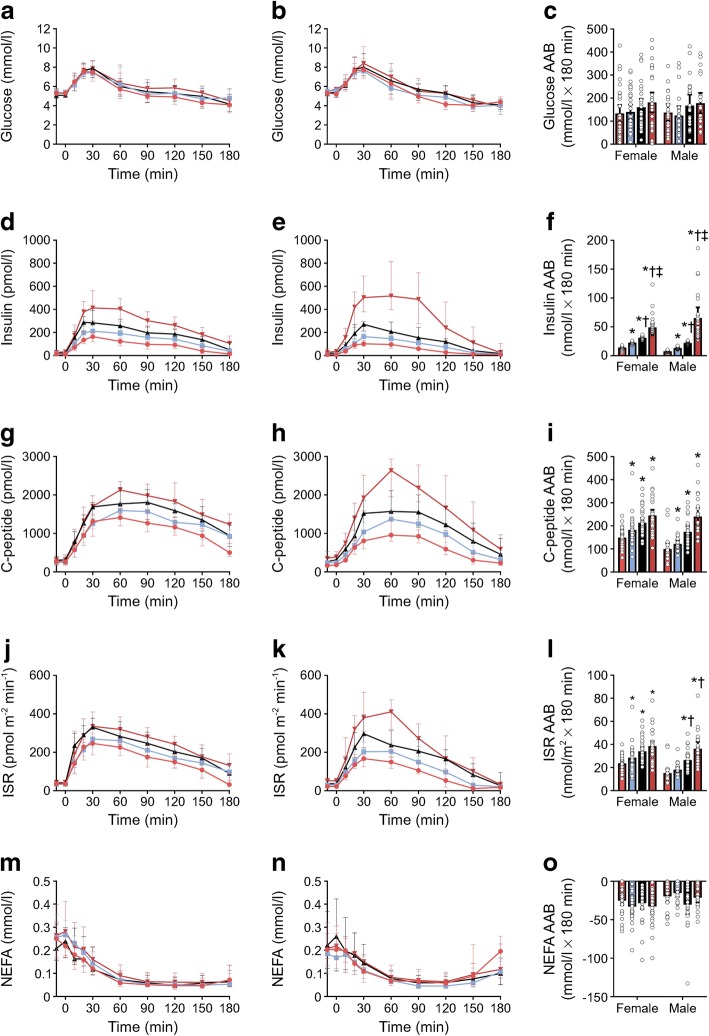
Fig. 3.
Sex-specific plasma metabolite and hormone concentrations in normoglycaemic women (a, d, g, j, m) and men (b, e, h, k, n) during the OGTT. The OGTT began at time 0 min. (a, b) Plasma glucose concentrations. (c) The AAB for the glucose response. (d, e) Plasma insulin concentrations. (f) The AAB for the insulin response. (g, h) Plasma C-peptide concentrations. (i) The AAB for the C-peptide response. (j, k) ISR. (l) The AAB for the ISR response. (m, n) Plasma NEFA concentrations. (o) The area below basal (ABB) for the NEFA response. Pink circles, Q1; blue squares, Q2; black triangles, Q3; red triangles, Q4. Data are median and interquartile range. *p< 0.05 vs Q1; †p< 0.05 vs Q2; ‡p< 0.05 vs Q3

