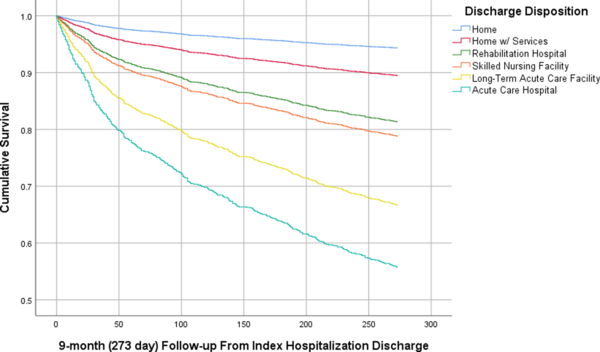
Figure 1.

Kaplan-Meier Curve Modeling Time to Death By Discharge Disposition1 Among Medicare Beneficiaries Age 65 and older Hospitalized in the First 3 months of 2015 with High-Acuity Emergency General Surgery Disease who Survived to Discharge (N = 2922)
1. Excludes those who died during index hospitalization (N = 273), were discharged to hospice (N = 81), or had an other/unknown discharge disposition (N =43).
2. Long-term acute care facility includes a Medicaid facilities and intermediate care facilities
