
Figure 3. Representative T-weighted images acquired using the proposed DCE-MRI technique.
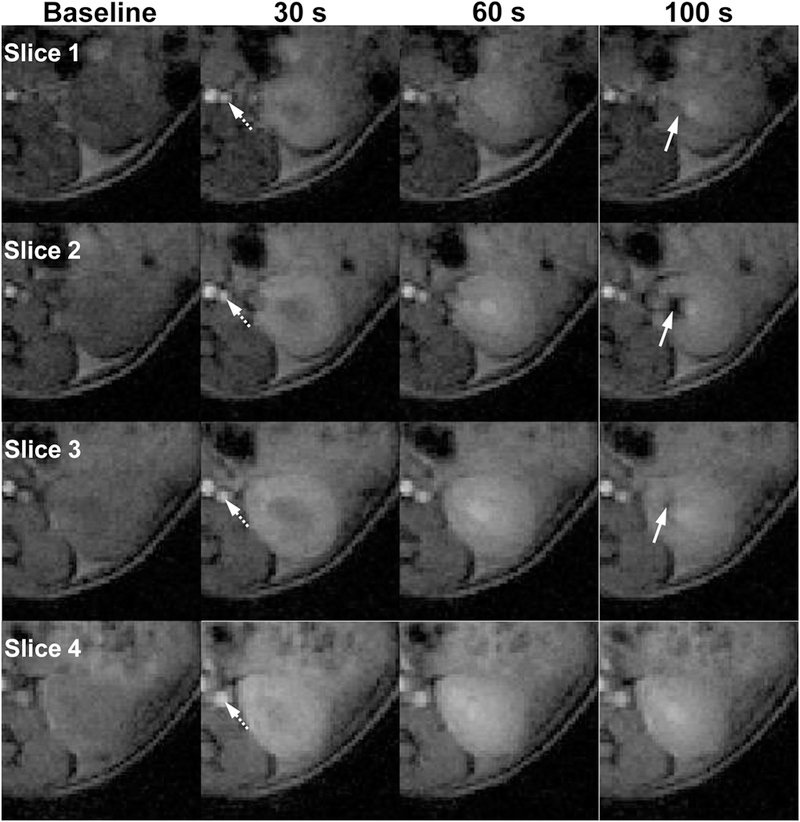
Images of four adjacent slices of one normal kidney at baseline, 30, 60, and 100 sec are shown. Sequential enhancement of different renal regions at different time points reflects renal perfusion, filtration, and tubular flow. Notably, gadolinium blooming effect causes signal dropout at late tubular phase, as indicated by white arrows.