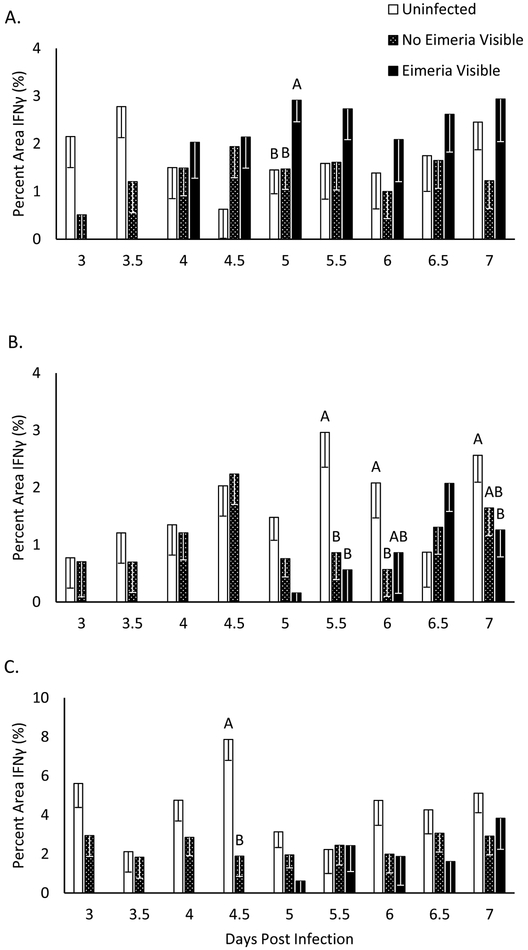
Figure 3: Interferon Gamma Quantification in Intestinal Sections.
IFNγ quantified with Image J as a percent area of fluorescence of the imaged intestinal section. Chickens were infected at day 19 of age and intestinal sections were collected on every 12 hours days 3-7 post infection. Eimeria visible samples are not present early in the infection because only gametogony stages of Eimeria infection were assessed. Each data point shows the average percent area of IFNγ fluorescence for 3 uninfected chicks or 4 infected chicks. A, B * Indicates significant difference at P<0.05.

