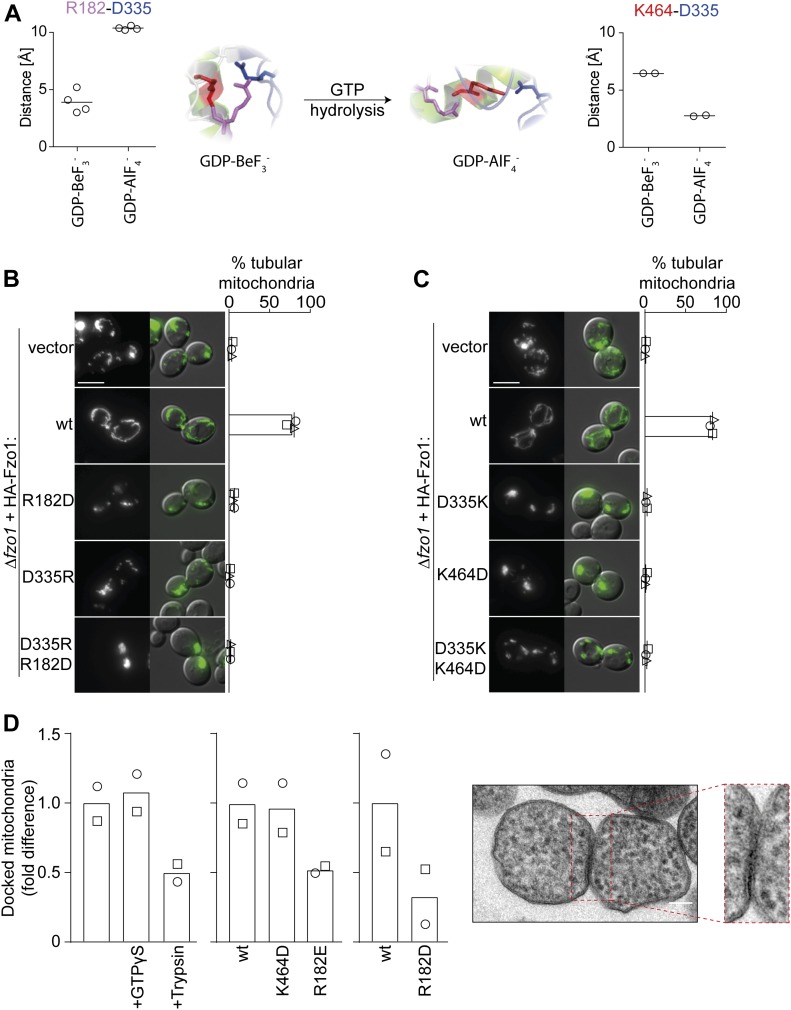
Figure 2. Double salt bridge swaps block mitochondrial fusion.
(A) Alternation of D335 positioning. Fzo1-MGD modelled on MFN1 bound to GDP-BeF3− (left) and GDP-AlF4− (right) and corresponding distance predictions between all charged ends of D335 and either R182 or K464, resulting in either four or two measurements, respectively. (B, C) Single charge swaps do not rescue mitochondrial fusion. Mitochondrial morphology of ∆fzo1 cells expressing the indicated HA-Fzo1 variants, co-expressing a mitochondrial-targeted GFP plasmid, analyzed as in Fig 1D. Scale bar: 5 μm. (D) In vitro analysis of mitochondrial docking sites. Mitochondria were purified from ugo1-2 cells (left) or from ∆fzo1 ugo1-2 cells expressing HA-Fzo1, HA-Fzo1K464D, HA-Fzo1R182E (middle), or HA-Fzo1R182D (right) and analyzed by TEM for docked events. Mitochondrial tethering was performed in the presence of 1 mM GTPγS or mitochondria were treated with 0.5 μg/ml trypsin before tethering, as indicated (left). At least 900 (left), 1,000 (middle), or 650 (right) mitochondria from two independent experiments were quantified, as described in Fig S2F, including mean (bars) and individual experiments (circles and squares). Example of a mitochondrial docking event (far right). Scale bar: 100 nm.

