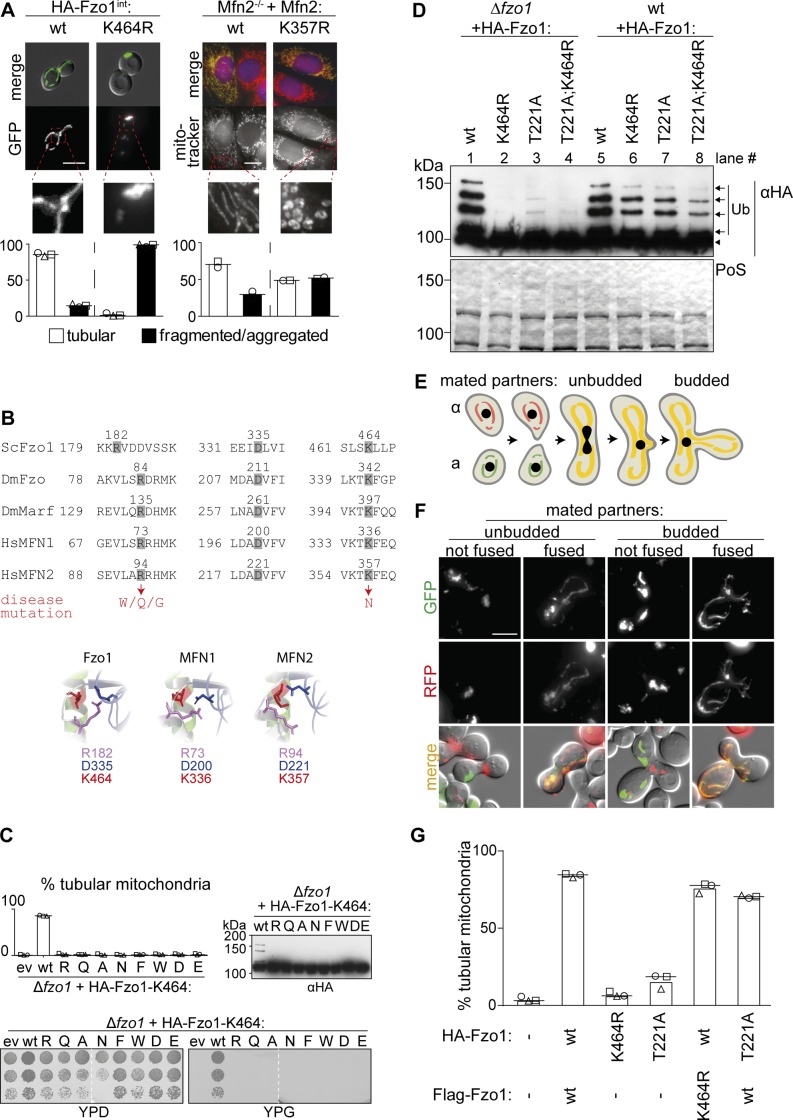
Figure S1. Role of the conserved lysine 464 for Fzo1 functionality.
(A) Mitochondrial morphology in yeast and mouse cells. Cells genomically expressing HA-Fzo1 were analyzed as in Fig 1D. Scale bar: 5 μm. MEF Mfn2−/− knockout cells were transfected with the indicated Mfn2 variants. Mitochondrial morphology of at least 75 fixed cells was analyzed using MitoTracker (red). Nuclei were visualized using DAPI (blue). Mfn2-Flag expression was visualized using Flag-specific antibodies (green). Scale bar: 10 μm. (B) Multiple sequence alignment (Clustal Omega [Sievers et al, 2011]) of salt bridge residues in Saccharomyces cerevisiae Fzo1, Drosophila melanogaster Fzo, and Marf and Homo sapiens MFN1 and MFN2 (top). Hinge region of the Fzo1-MGD (bottom, left) and MFN2-MGD (bottom, right) structural models based on MFN1-MGD bound to GDP-BeF3− (PDB ID 5YEW, bottom, center) (Yan et al, 2018). (C) Mitochondrial morphology (top left), ubiquitylation (top right), and respiratory capacity (bottom) of ∆fzo1 cells expressing indicated HA-Fzo1 variants, as indicated in Fig 1. (D) Ubiquitylation of indicated HA-Fzo1 variants expressed in wt or Δfzo1 cells, as in Fig 1C. (E) Schematic representation of mitochondrial fusion during mating of cells of opposite mating type (“a”: BY4741 and “α”: BY4742) and subsequent zygote formation. (F) Example yeast cells from the in vivo mating assay, scored as “fused” or “not fused.” Scale bar: 5 μm. (G) Quantification of mitochondrial morphology of Δfzo1 cells expressing the indicated HA-Fzo1 and Flag-Fzo1 variants, co-expressing a mitochondrial-targeted mCherry plasmid, analyzed as in Fig 1D. PoS, PonceauS staining.

