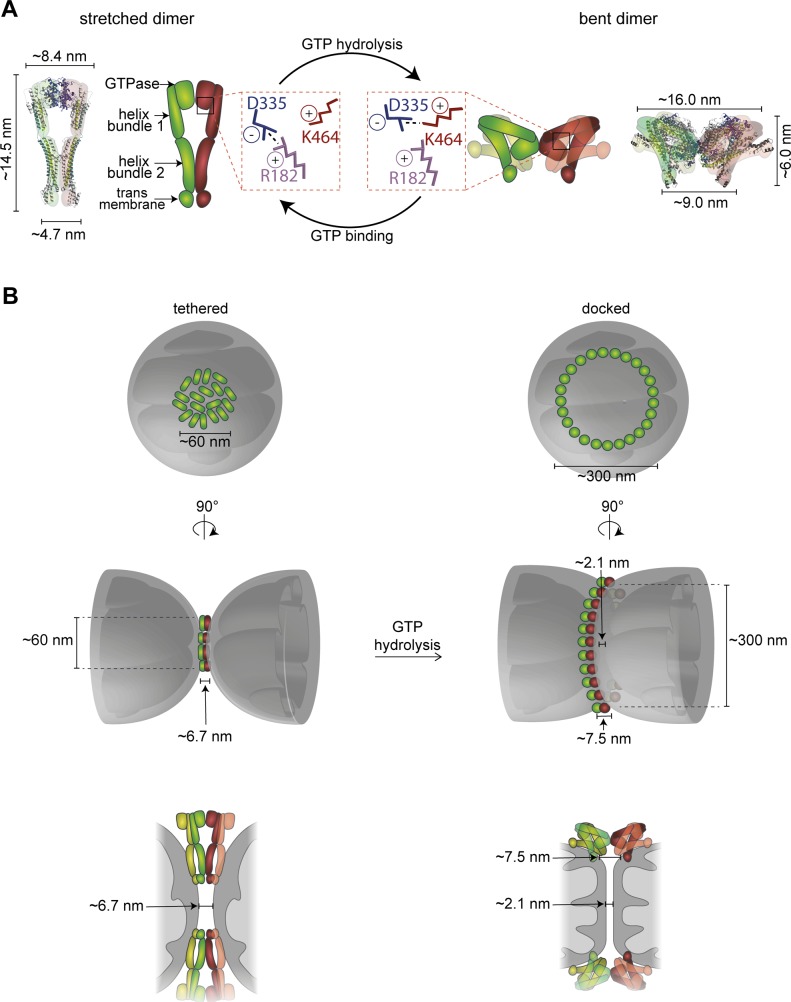
Figure S4. Model of mitochondrial tethering.
(A) Schematic model of Fzo1 subunits in stretched (left) and constricted (right) conformation, highlighting the triparty salt bridge. Fzo1 was modelled on BDLP bound to GMPPNP (left) and GDP (right). Size estimations were calculated using PyMol. (B) Integration of the dimensions of the mitofusin structural models (Low & Lowe, 2006; Low et al, 2009; Qi et al, 2016; Cao et al, 2017; Yan et al, 2018) into the in organello–observed distances between the OM in tethered and docked mitochondria (Brandt et al, 2016). Top view (top) and 90° tilted side view (middle) of schematic model of distribution of protein-dense structures on OMM. Bottom: Schematic model of Fzo1 complexes localizing to the mitochondrial fusion site.

