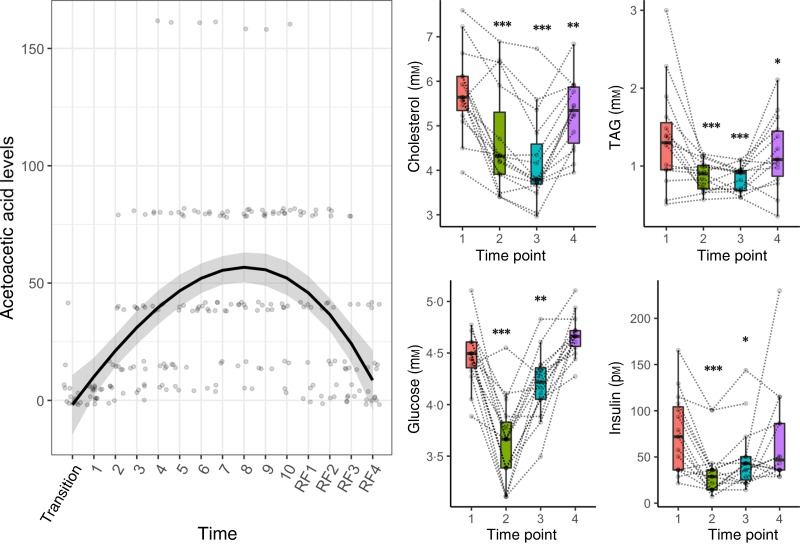
Fig. 2.
Metabolic switch from carbohydrates to fatty acids and ketones induced by a 10-d fasting. A regression spline was fitted on individual acetoacetic values to show the variations in ketosis during the course of the study. The distribution is summarised by box plots, with the upper and lower hinges extending to the first and third quartiles. Statistical significance was assessed with an ANOVA in comparison with pre-fasting baseline levels (* P < 0·05, ** P < 0·01, *** P < 0·001). Biomarker levels are presented for each individual across the four phases of the intervention (1, baseline examination; 2, at the end of the 10-d fasting period; 3, on the fourth day of the following progressive refeeding (RF); 4, 3 months after the fasting period).

