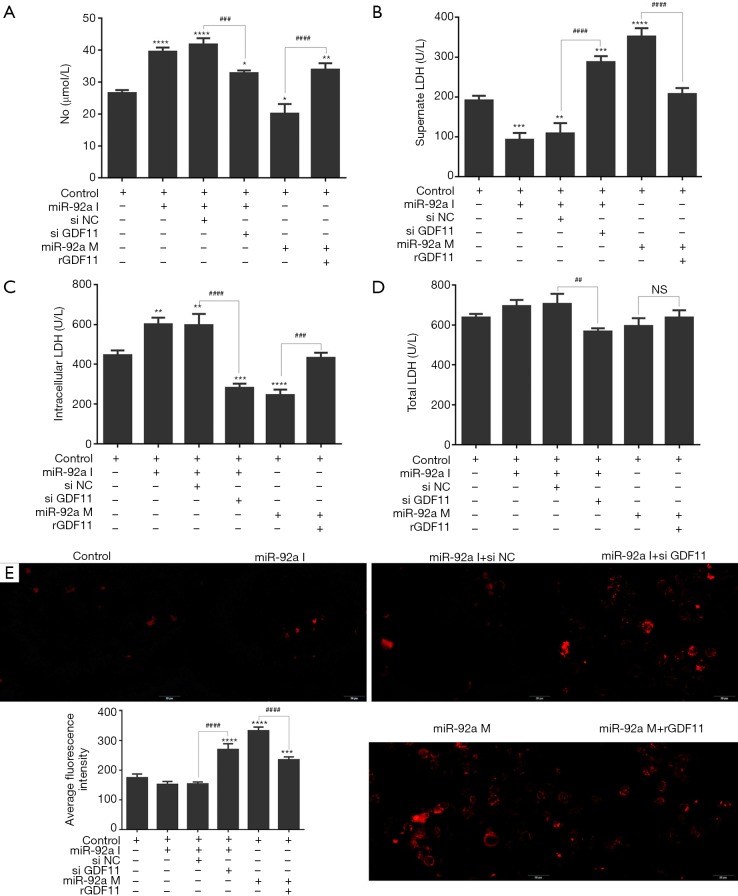
Figure 7.
LDH and NO in EPCs after various treatments. EPCs underwent miR-92a inhibition or reversed by siGDF11 and miR-92a mimic or rescued by over-expression of GDF11. Cells were then harvested for the detection of total, intracellular, supernatant LDH by ELISA (*, P<0.05, **, P<0.01, ***, P<0.001, ****, P<0.0001 vs. control group; ###, P<0.001, ####, P<0.0001 si NC vs. si GDF11, and mimic vs. mimic with rGDF11). Intracellular ROS content in EPCs after various treatments. EPCs underwent the same treatment as before. Cells were then harvested for the detection of intracellular ROS by ROS Fluorescent Probe-DHE (***, P<0.001, ****, P<0.0001 vs. control group; ####, P<0.0001 si NC vs. si GDF11, and mimic vs. mimic with rGDF11). I: inhibitor; M: mimic; si NC: siRNA negative control; si GDF11: si RNA GDF11; rGDF11: recombinant GDF11.

