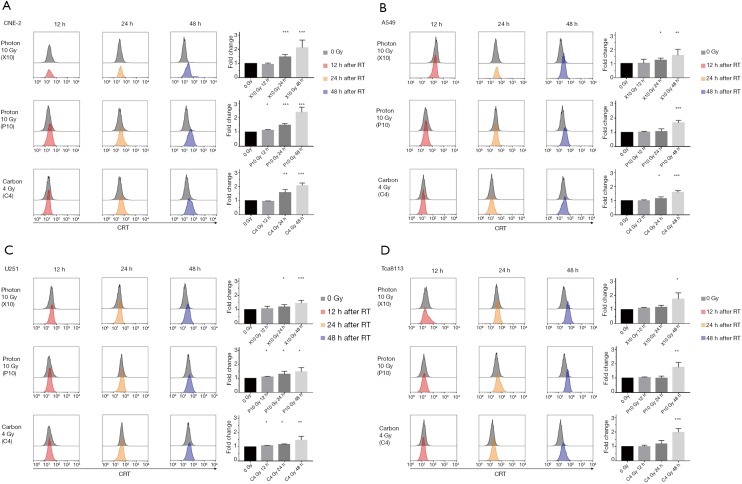
Figure 1.
Comparison of ecto-CRT exposure in different time after RT. Four human cancer cell lines were mock-irradiated (0 Gy) or exposed to the indicated single physical dose radiation with photon (X-rays), proton and carbon-ion beams. The exposure levels of ecto-CRT were evaluated by flow cytometry in 12, 24, and 48 h after irradiation. The bar chat represented the fold change of median fluorescence intensity (MFI) of each irradiated group compared with control group (0 Gy). All the groups were repeated at least three times with similar results. The results are expressed as the mean ± SD of independent experiments. Asterisks denote statistical significance relative to 0 Gy group. *, represents P<0.05; **, represents P<0.01; ***, represents P<0.001. CRT, calreticulin; RT, radiation therapy.

