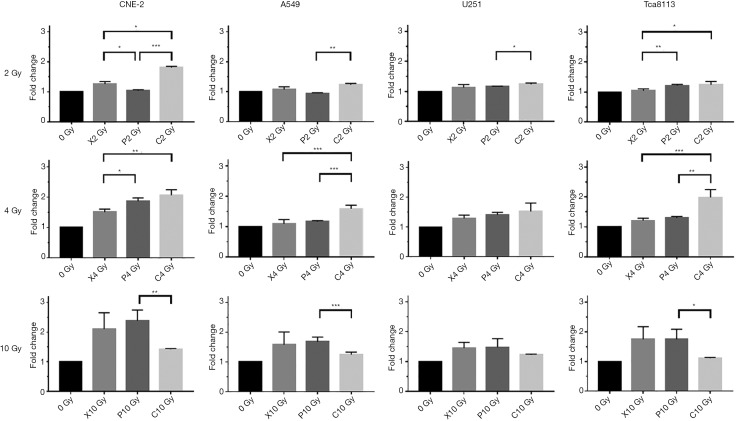
Figure 3.
Comparison of ecto-CRT exposure with same physical doses but with different types of beams. Four human cancer cell lines were mock-irradiated (0 Gy) or exposed to 2, 4 and 10 Gy with three types of RT beams, respectively. The exposure levels of ecto-CRT were evaluated by flow cytometry at 48 h after irradiation. All the groups were repeated at least three times with similar results. The results are expressed as the mean ± SD of independent experiments. *, represents P<0.05; **, represents P<0.01; ***, represents P<0.001. CRT, calreticulin.

