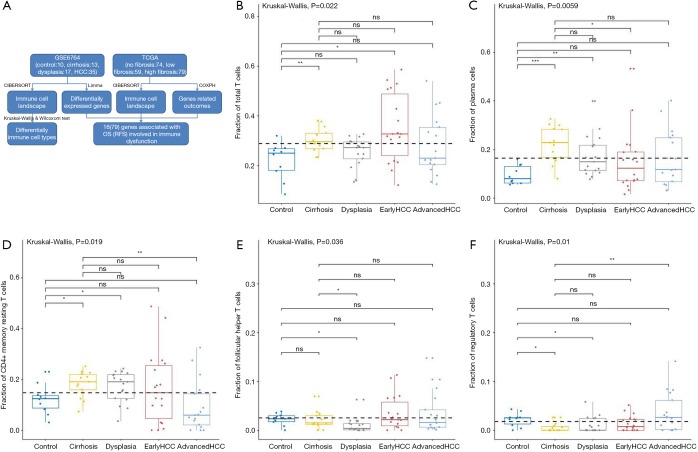
Figure 1.
The workflow and the fractions of T cells and plasma cells in various liver tissues. The workflow of our studies is shown (A). CIBERSORT immune cell fractions were determined for each sample; each dot represents one sample. Mean values and standard deviations for each cell subset including total T cell (B), plasma cells (C), CD4 memory resting (D), follicular helper (E), and T cells gamma delta and Tregs (F) were calculated for each sample group and compared using Kruskal-Wallis test and Wilcoxon test.

