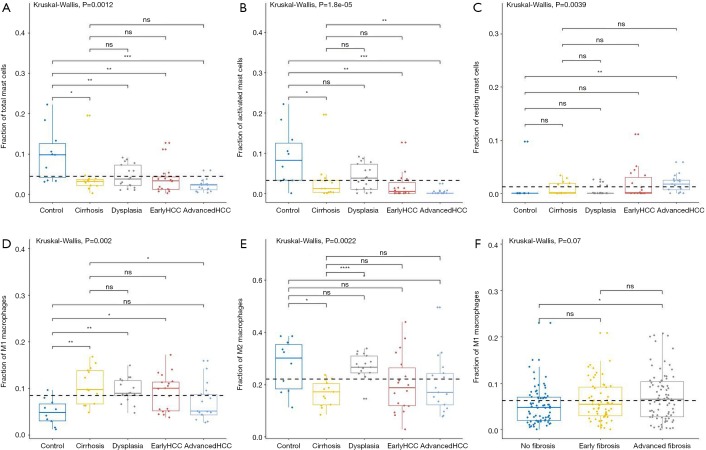
Figure 4.
The fractions of mast cells and macrophages subtypes in various liver tissues. CIBERSORT immune cell fractions were determined for each sample; each dot represents one sample. Mean values and standard deviations for each cell subset including total mast cell (A), activated mast cells (B), resting mast cells (C), macrophages M2 (E), and macrophages M1 in GSE6764 and TCGA (D and F respectively) were calculated for each sample group and compared using Kruskal-Wallis test and Wilcoxon test.

