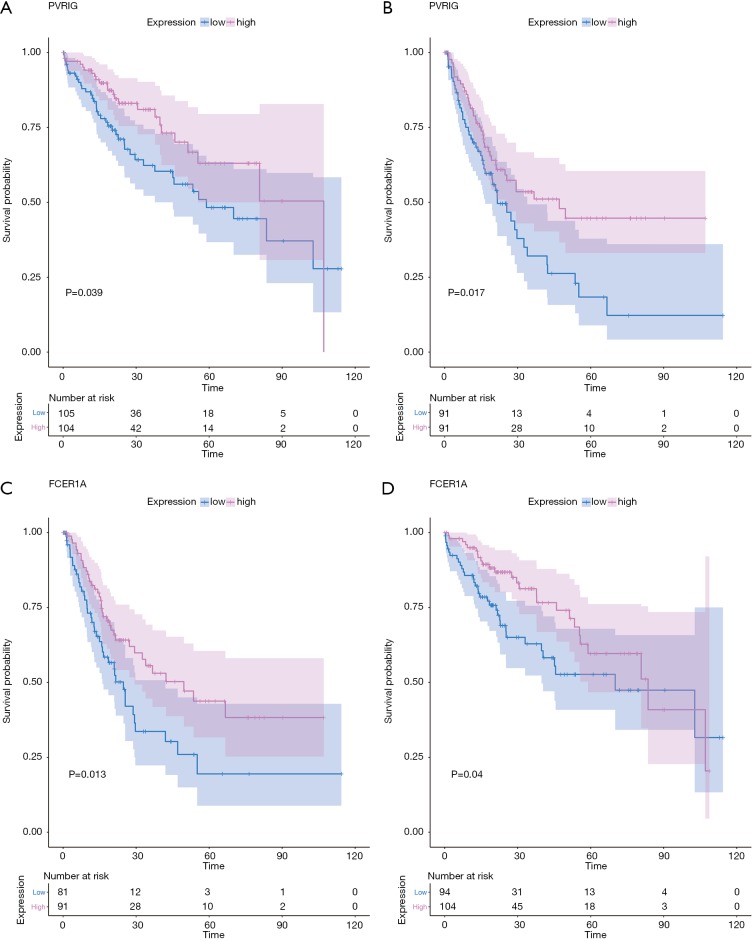
Figure 7.
Kaplan-Meier estimates of time to OS and RFS for PVRIG and FCER1A. Patients were stratified into high and low categories based on the expression level of PVRIG for Kaplan-Meier survival analysis by OS (A) and RFS (B). The similar results of FCER1A were shown (C and D). RFS, relapse-free survival.

