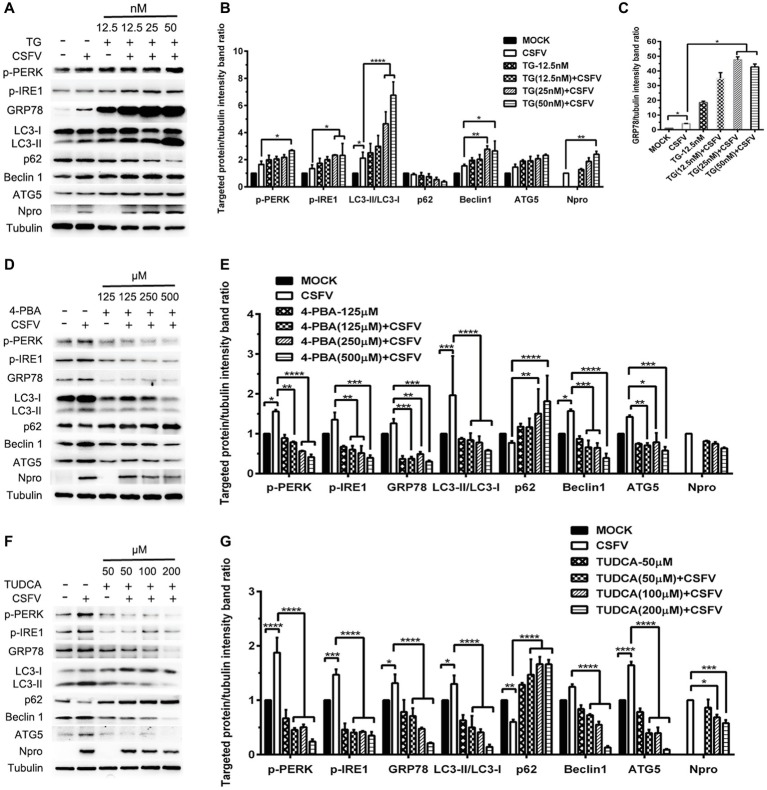
Figure 8.
Pharmacological regulation of ER stress alters expression autophagic proteins in CSFV-infected 3D4/2 cells. 3D4/2 cells were treated with the indicated concentrations of TG (A), 4-PBA (D) and TUDCA (F) prior to viral infection as described in the legend of Figure 6, and then collected for preparation of protein samples according to the description in the “Materials and Methods”. Samples were quantitated by BCA assays and then loaded for western blot analyses using specific antibody against the indicated targets. Tubulin was used as a loading control. Grayscale value of the bands were analyzed with ImageJ software, and generations of images for protein quantitation and all statistical analyses (B,C,E,G) were performed with GraphPad Prism 6. All the pictures of western blot represent one of two independent experiments, and all the quantitative data shown are expressed as mean ± SD values of two independent experiments. Two-way ANOVA test: *p < 0.05; **p < 0.01; ***p < 0.001; ****p < 0.0001.

