Figure 9.
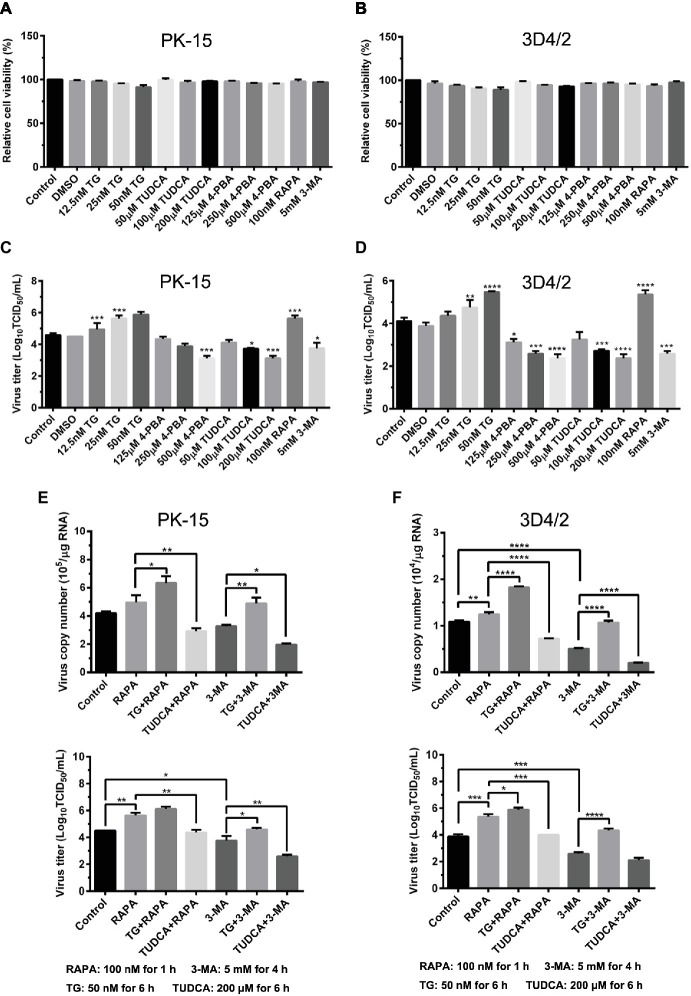
Autophagy-regulated CSFV replication in cultured PK-15 and 3D4/2 cells can be mediated by ER stress. (A) The cell viability of PK-15 and 3D4/2 (B) cells were measured by the CCK-8 assays after treatments with the indicated concentrations of TG (12.5, 25 and 50 nM), 4-PBA (125, 250 and 500 μM) and TUDCA (50, 100 and 200 μM). Cells pretreated with only DMSO (0.1%) or sterile ultrapure water were regarded as the control group. After further incubation for the indicated time as described in the “Materials and Methods”, cells were further incubated with 10% (v/v) CCK-8 diluted in fresh medium for 1 h at 37°C, followed by measurement of the absorbance at 450 nm with a Ledetect 96 microplate reader. Each sample was assayed in triplicate and the data represent the mean ± SD of two independent experiments. For virus titration assays, PK-15 (C) and 3D4/2 (D) cells cultured in 6-well microplates were pretreated with the indicated concentrations of TG, 4-PBA, RAPA and 3-MA for the indicated time, followed by infection with 0.5 MOI of CSFV. Twenty-four hours post-infection, the cells and supernatants of each treatment were collected for virus titration determined with TCID50 assays through an indirect immunofluorescence assay using mouse anti-CSFV E2 antibody and Alexa Fluor 488-labeled goat anti-mouse IgG(H + L) secondary antibody. Virus titers were calculated according to Reed-Muench method and expressed as Log10(TCID50/mL). Each sample was assayed in four replicates and the data represent the mean ± SD of two independent experiments. To investigate the effect of ER stress-mediated autophagy on CSFV replication in vitro, PK-15 (E) and 3D4/2 (F) cells cultured in 6-well plates were pretreated with 50 nM TG or 200 μM TUDCA for 6 h, and then subject to treatment with 100 nM RAPA for 1 h or 5 mM 3-MA for 4 h prior to CSFV infection. After a 1.5 h of incubation, the cells were further cultured in maintenance media in the presence (TUDCA, RAPA, 3-MA) or absence (TG) of the drugs for 24 h. Additionally, cells pretreated with only DMSO (0.1%) were regarded as the control group. The cells and supernatants of each treatment were collected for detecting the copies of NS5B genes and viral titers using real-time RT-PCR and TCID50 assays, respectively. The results are expressed as mean ± SD values of two independent experiments. For all assays, generations of images for quantitation and all statistical analyses were performed with GraphPad Prism 6. All data presented were analyzed by one-way ANOVA tests: *p < 0.05; **p < 0.01; ***p < 0.001; ****p < 0.0001.

