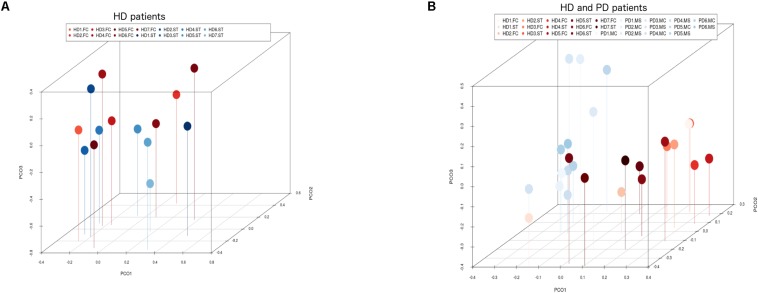
FIGURE 7.
Principal component analysis of fungi identified by next-generation sequencing. 3D principal component analysis scatter plots of HD and Parkinson’s disease (PD) patients. Panel (A) shows the distribution between striatum (plots in blue) and frontal cortex (plots in red) regions of seven HD patients. Panel (B) shows the distribution between HD patients (plots in red) and PD patients (plots in blue). The UniFrac method was used to calculate this parameter. ST, striatum; FC, frontal cortex; MC, motor cortex; MS, mesencephalon.

