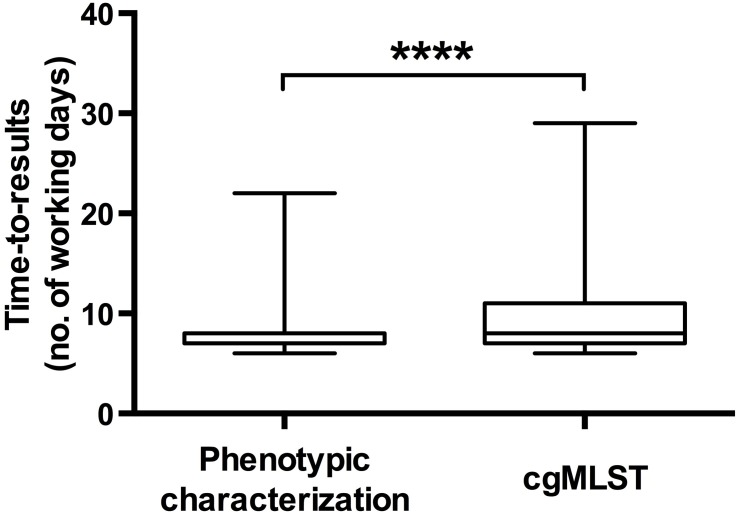
Fig. 4.
Time-to-results comparison between cgMLST and phenotypic methods. Calculations are based on 1113 isolates received in 2017 at the YNRL for the phenotypic characterization (mean=7.5 days) and 1440 isolates received in 2018 for the cgMLST (mean=8.8 days). Statistical analysis was performed with Student's t-test. ****, Difference highly significant, with P value <0.0001.

