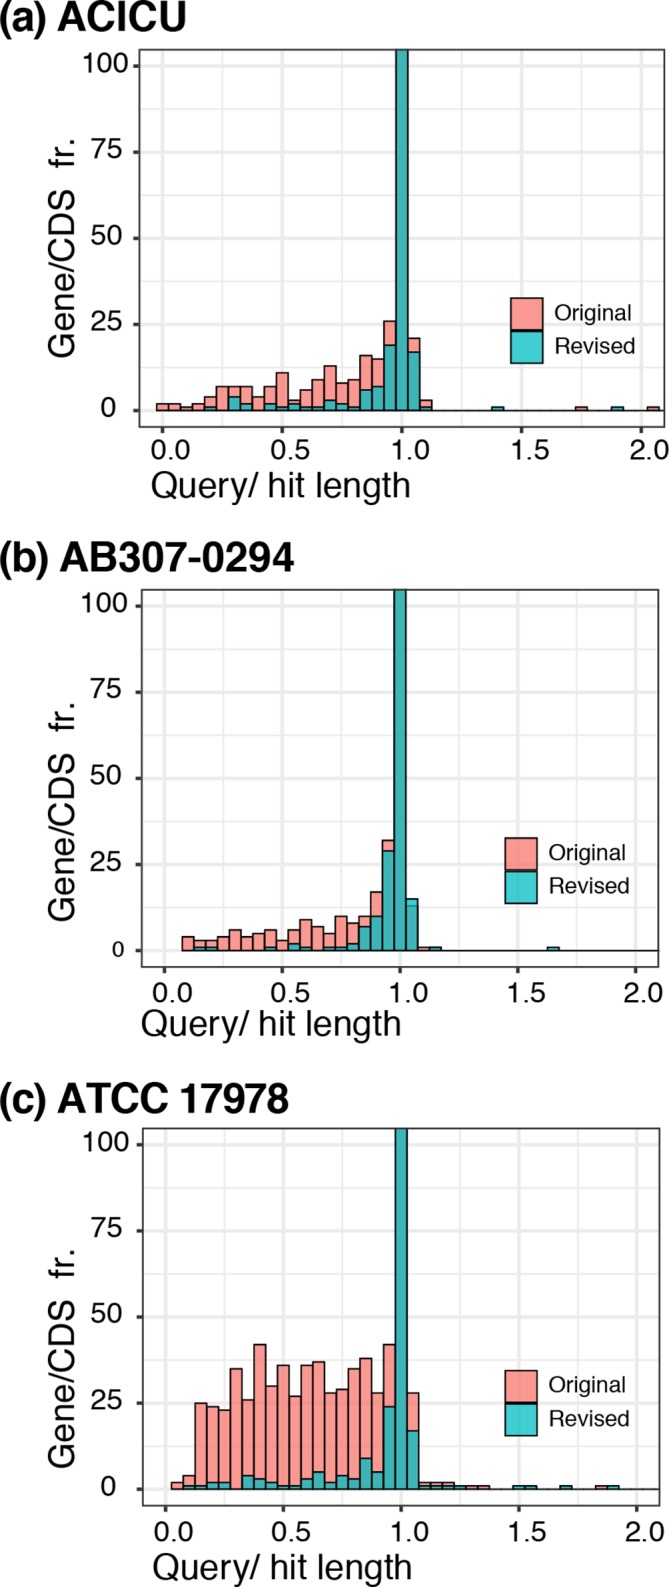
Fig. 1.

Histograms of CDS lengths relative to the length of the top hit in UniProt, in the original versus revised genomes. (a) ACICU GenBank accession no. CP000863.1 (original) and CP031380 (revised), (b) AB307-0294 GenBank accession no. CP001172.1 (original) and CP001172.2 (revised), and (c) ATCC 17978 GenBank accession no. CP000521.1 (original) and CP012004.1 (revised). The x-axis shows the ratio of CDS length to the length of the closest hit in the UniProt TrEMBL database. The y-axis shows gene frequency and is truncated at 100 (the centre bar extends to ~3000 genes). A tight distribution around 1.0 indicates that the assembly’s CDSs match known proteins, supporting few indel errors in the assembly. A left-skewed distribution is characteristic of an assembly with indel errors that lead to premature stop codons.
