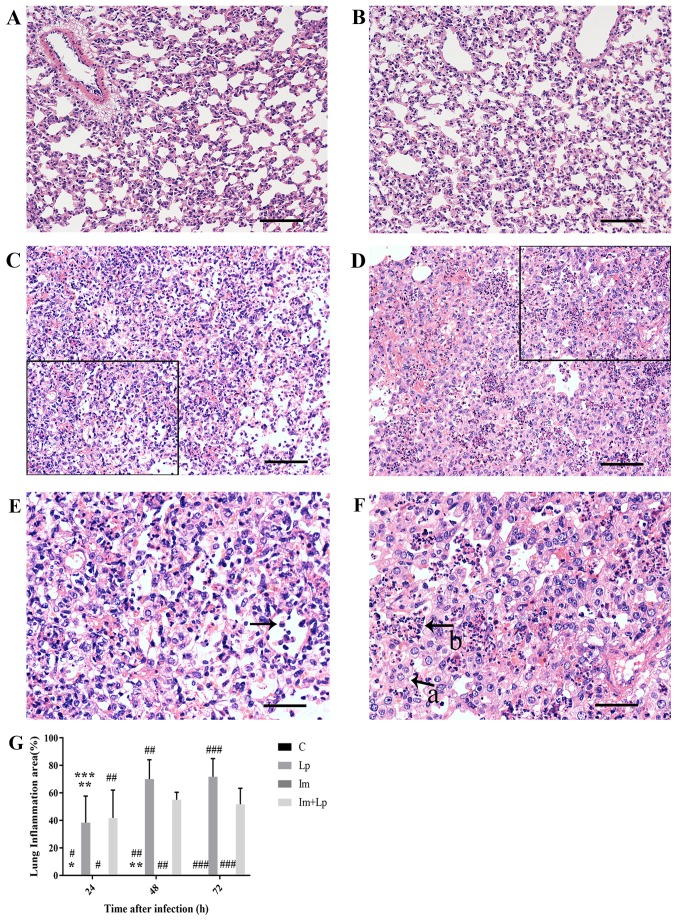
Figure 2.
H&E staining of lung tissue sections 72 h after Lp infection. (A) In the control group, the tissue structure was normal. (B) In the immunosuppressed group, the tissue structure was normal. (C and E) In the Lp-infected group, the tissue structure was more disordered with the alveoli and alveolar walls unclear and a large number of inflammatory cells were visible (indicated by arrow). (E) is enlargement of the black box of (C). (D and F) In the immunosuppressed Lp-infected group, the alveolar walls were extensively thickened with the total number of alveoli was reduced (indicated by arrow a), extensive structural disorder was observed and a large number of alveoli were filled with inflammatory exudate (indicated by arrow b). (F) is enlargement of the black box of (D). (G) Quantified lung inflammation area (%). Scale bar, 100 µm (A-D) and 50 µm (E and F) *P<0.05 vs. Lp 24 h; **P<0.05 vs. Lp 48 h; ***P<0.05 vs. Lp 72 h; #P<0.05 vs. Im + Lp 24 h; ##P<0.05 vs. Im + Lp 48 h; and ###P<0.05, vs. Im + Lp 72 h. Lp, Legionella pneumophila; Im, immunosuppressed.

