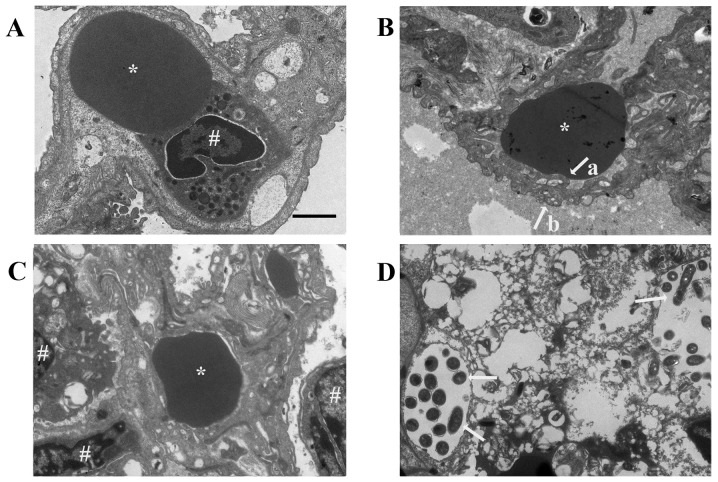
Figure 3.
Electron micrographs of Lp-infected guinea pig lung tissues 72 h after infection. (A) Ultrastructure in the lung tissues from the control group was normal. (B) In the Lp-infected group, the lung tissue was disordered. The surfaces of pulmonary capillary endothelial cells (indicated by arrow a) and alveolar epithelial cells (indicated by arrow b) were uneven, and the basement membrane between the two was blurred. (C) In the immunosuppressed group, the ultrastructure was close to normal. (D) In the lung tissues from the immunosuppressed Lp-infected group, destruction to the tissue structure was extensive and severe, with larger quantities of Lp infiltration (indicated by arrows). * denotes red blood cell and # denotes nucleus. Scale-bar, 2 µm. Lp, Legionella pneumophila.

